The end of Room Eight 9 Dec 2016 11:23 AM (8 years ago)
My name is Matt Johnson, and I’m the editor (to the extent such a thing exists) of Room Eight. This title is essentially ceremonial; I don’t really do anything except keep the server running and occasionally answer questions about the site for the writers. I agreed to take over the site from the founders, Ben Smith and Gur Tsabar, in 2013. Room Eight has a colorful history, reaching back to 2007 when the landscape of online publishing was dramatically different than it is today. The site has passed through many hands, and I’m afraid mine will have to be the last.
On December 31, Room Eight will most likely shut down, unless someone else is able to take it over. The site will disappear, not simply stop publishing.
The reason for this is that Room Eight is a serious legal liability. It has recently been the recipient of very real legal threats relating to the material published here. Such threats implicate me, my employer, and my family. Room Eight has never made any revenue and has no other resources with which we could respond to legal action against us. The fact is, Room Eight is not journalism; it’s an unmoderated forum. While the “about” page makes it clear that opinions published here do not represent those of Alley Media Ventures LLC, that doesn’t stop someone from suing us anyway and requiring us to respond legally.
Furthermore, the virtue of offering this type of forum is not what it was in 2007. Room Eight is a small site with an obviously identifiable owner (me). Sites like this used to be one way to establish respectability on the Internet as an independent writer. This is no longer even close to true, as platforms like WordPress.com, Medium, and Blogger let people with interesting or controversial ideas put them out to the world, for free, and provide better community support and discoverability than a single, self-hosted WordPress site ever could. Most importantly, these platforms are owned by huge companies with a legal department that can effectively refute the claim that an author’s content is not the platform’s responsibility. Although I obviously feel the same is true of Room Eight, I cannot realistically defend it from such claims.
I’m not issuing any sort of moral judgment or argument about this situation, I’m just telling anyone who still enjoys Room Eight what’s happening and why. To the writers past and present, I know many of you cherished this forum, but reality is what it is and this is what needs to happen. I will not destroy your content and if you want access to it privately so you may post it elsewhere, I will assist you in doing that; please contact me.
To anyone out there who feels they have the financial, technical and temporal resources to become the next caretaker of Room Eight, you’re welcome to contact me at editor@r8ny.com to discuss. However, I’m not really holding out serious hope of finding a new home for the site, and if it doesn’t happen by December 31, then we will have to go dark.
Thank for for your support and understanding, and for being readers of Room Eight.


Trump, Clinton, Paul Theroux’s Deep South, the Decline of the Midwest, Etc. 13 Nov 2016 12:18 PM (8 years ago)
Hello world!
Time to Take Down the American Flag 6 Nov 2016 10:07 AM (8 years ago)
It’ something I usually do after Veteran’s Day. But this year, I’m going to do it before Election Day. Because something bad is going to happen on that day. Or something terrible. Or something even worse than that, which would be a repeat of 2000. And people are going to be confused by what is going on. But I know what is going on. This is what has been done to this country by Generation Greed, something they don’t want to face but find more difficult to ignore after 2008, something they want rationalizations for, scapegoats for, something they want an excuse for. That’s why they are so angry. And this is what has been allowed to happen the generation to follow, Generation Apathy. “We’re screwed anyway, let’s just worry about ourselves.” Uh huh. Good luck with that.
I’ve seen this election analyzed every way to Sunday. By race. By education level. By occupation. By sex. The electorate divided into categories this way and that way. How about by age group? How about by generation? What would that show? Hopefully based on exit polls, we’ll find out. This country once sought to build toward a better future. But for 35 years it has been cashing in the future, now the present, to make things easier in the present, now the future. Those over 59 should be embarrassed about even voting, and making choices for those who will be paying for the choices they’ve already made.
FBI Director Crossed The Line 31 Oct 2016 8:51 AM (8 years ago)
A strong argument could be made that FBI Director James Comey violated the Hatch act. (a 1939 law intended to keep federal employees from directly supporting candidates) Senate Minority Leader Harry Reid suggests he may have.
At a minimum Comey violated FBI protocol of not interfering with an election only 60 days out.
Of course when Democrats make the case of why isn’t the FBI making as equally a case about Donald Trump’s possible involvement with reported Russian hacking of emails or Trump’s possible Russian Business ties, something he has denied, the Democrats make a solid point.
Either the FBI Director has found a smoking gun or what happens if Comey’s Letter to committee heads, costs Clinton the election, and it turns out all these “new” emails are ones the FBI has already looked at.
Trump says this is the worst thing since Watergate.
Here is my 2008 interview of Trump that resurfaced in the campaign, CNN, and the <a href="http://www.sfgate singulair allergy medicine.com/politics/article/Trump-praises-Hillary-Clinton-great-NY1-video-9997813.php”>San Francisco Chronicle. Also the Washington Post.
Generation Greed and the Election 23 Oct 2016 8:38 AM (8 years ago)
This year’s election is finally coming to an end, and as expected I didn’t watch any of the debates. Did I miss anything?
Did the candidates acknowledge that the generations born after 1957 or so have, on average, been paid less at work at each phase of their lives than those born earlier?
And that they have been disadvantaged in public policy, as past tax cuts, additional spending on benefits for today’s seniors, and richer public employee pensions for those cashing in and moving out have been paid for by soaring public debts, higher taxes, a deteriorating infrastructure, cuts in pay and benefits for future public employees, and likely poverty and ill health in old age for younger generations as the country goes broke and their senior benefits are cut?
Did anyone talk about the 30-year party of paying people less but selling them more, with the difference covered by soaring public and private debts and inadequate retirement savings? Selling off pieces of the next generation’s future to pay for imports in excess of what we export?
Did anyone talk about the crisis of demand in the economy because those age 58 and younger have less to spend and are retiring into poverty? The crisis of investment because businesses no longer have an answer to the question “who are you going to sell to, and where will they get the money to pay for it given falling wages?” And the fact that no one knows how to solve this other than yet more borrowing – to be paid by someone someday – to keep the debt-driven economy going a few years more?
Did anyone express concern that U.S. life expectancy is falling for those born after 1957 or so after having risen for – decades, if not centuries?
Or express regret about the diminished childhoods of those coming of age in the 1970s and after, due to choices adults made to prioritize their own wants over family stability, and the reverberations of that on younger generations’ own families and children?
Did anyone talk about where the country will be going the next 20 or 30 years as a result of what has been done during the past 20 or 30 years?
Didn’t think so.
In fact, when I enter the names of the two Presidential candidates and “generational equity” in Google, the only stuff that comes up is stuff I myself have written.
A debate worth watching would have had Hillary Clinton and Donald Trump apologizing on behalf of their generations.
Senator Clinton would have apologized, in particular, on behalf of a political/union class that is taxing more and delivering less as a result of past self-enrichment, particularly in places dominated by Democrats such as New York City.
Donald Trump, in particular, would have apologized on behalf of tycoons who paid themselves richly while often creating little of real value, based on financial engineering, tax games, and government-created bubbles – before being bailed out by zero percent interest rates. And in particular, apologized for higher federal taxes and future cuts in senior benefits as a result of the tax cuts and breaks the executive/financial class got, particularly in Republican administrations.
Instead, the former pretended things were fine while promising only to tread water with respect to our mortgaged and diminished future – making the current and future deficit and crisis no worse that it already is. While the latter provided rationalizations for Generation Greed while identifying scapegoats.
This country has reached the point where it has become more and more difficult to cover up the damage from selling the future (now the present) so that those in generations could take more – and some of them more than others – and put in less in the present (now the past).
The fact that younger generations have been left worse off as a result is something almost universally known but never spoken of, particularly not in this campaign. But it shows up in the data, which also implies that many people have found themselves much worse off than they once were as individuals.
The data wasn’t discussed either. There are so many comparisons that could be made using recently-released American Community Survey data for 2015 and the first day of ACS data in 2005, I’m surprised there isn’t one in the news every day in every place. Particularly when the data is easily accessed here.
http://factfinder.census.gov/faces/nav/jsf/pages/index.xhtml
So here is another one.
As noted previously, those in retirement are getting richer as the less well off “greatest” generation dies off and the richest generations retire. The best off generations in U.S. history are now age 59 to 86, and many are enjoying years of leisure and benefits that those following will never see.
Meanwhile those in their pre-retirement years were hit hard in the Great Recession, as were those just entering the labor force. As a result, in a continuation of a long-term trend, average work earnings are down, not only because of the business cycle but also in a long-term sense. One sees this by comparing 2005, three years after one recession hit bottom, with 2015, five years after the low point of the Great Recession, in this case for all workers age 16 plus with work earnings. The spreadsheet with this data is here.
median-by-state-acs_15_1yr_b20002
One finds that in almost every state median earnings per worker (half of all workers earn more, half earn less) is down significantly when adjusted for inflation.
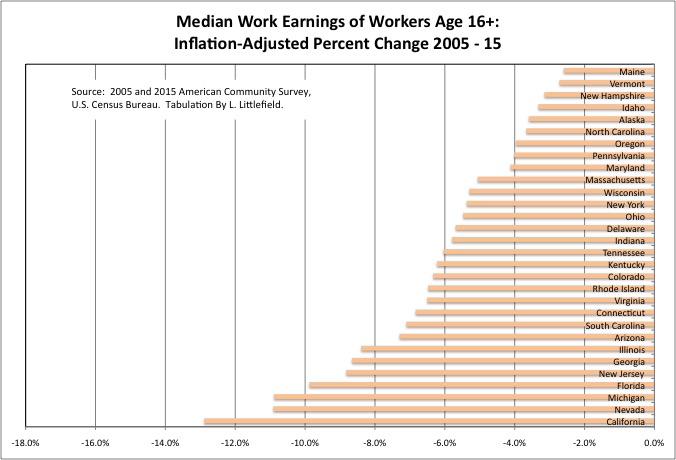
The worst off is California with a huge reduction of 12.9% — not what I would have expected given that the Bay Area of California is one of the few places where those at the top are still getting ahead. These days even hedge fund managers living in New Jersey and Connecticut are finding out that happens to top predators in an ecosystem when the bottom of the food chain collapses due to excess predation. Median earnings for this population are down by 8.8% and 6.8% respectively. The decrease for New York State is 5.4%.
The only places where median inflation-adjusted work earnings increased over a decade are states that benefitted from the oil and gas boom and other mineral production. But that boom has collapsed in a massive bust, so now these same states are seeing their residents’ income fall.

The decreases in median work earnings have been even greater for males, and are in some cases enormous. We are talking about 16.1% for Michigan, 15.1% for Florida, 14.1% for California and Nevada, 12.8% for Kentucky, 12.7% for Arizona, 11.8% for South Carolina, 10.8% for Tennessee, 10.5% in North Carolina, 10.3% in Georgia, 10.1% in New Hampshire, etc. This is at a time of low inflation, so it isn’t just a case of wages rising but not keeping up with fast rising prices. Meanwhile, as the cost of public employee retirement continues to rise, many people in these states are facing tax increases and service cuts.
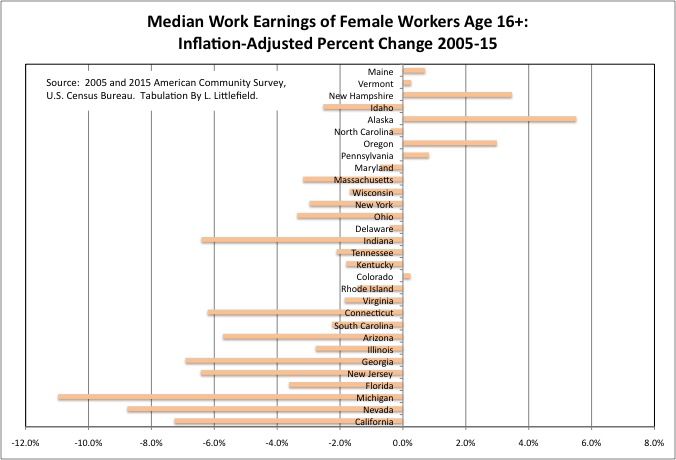
Men still tend to earn more, on average, than women, but this isn’t just a case of women getting ahead at the expense of previously advantaged men. In most states the median inflation adjusted earnings of women fell was well.
And my guess is that the only reasons it wasn’t worse for women are the same reasons their pay was lower to begin with. Women are more likely to work in fields such as health care and social services where the pay may not be high, but with revenues coming from the government it didn’t fall as much either. Women are now more likely to complete college. And women may have already been more likely to be working part time in 2005 as a result of family responsibilities, whereas more men are working part time now because they have no choice.
For men and women doing the exact same work for the exact same hours and effort, my guess is the gap between male and female earnings is much smaller. And so is the difference in how hard those in each gender were hit in the past decades.
With these kind of decreases in median work earnings, would you believe that the big “progressive” idea floating around in the election has been increases in Social Security benefits for the already-retired in excess of the rate of inflation? Paid for how? The same way the tax cuts were paid for. By someone else someday.
Most of those now working are unlikely to get pensions, let alone the retroactively enriched pensions older generations of public employees got. Their Social Security is set to be cut 25 percent in 2020. Having saved less for retirement and borrowed more to offset their failing wages over the decades, rather than cut their lifestyle, their income is set to plunge even more when they are no longer working. And their spending and standards of living will decline drastically.
And they will be forced to pay higher taxes out of their shrinking incomes to pay for everything Generation Greed promised itself while also voting for politicians who promised tax cuts – and if unionized voting for two-tier contracts with lower pay and benefits for future workers.
These changes, and other negative social changes for those in younger generations, are huge, huge, huge. And what came out in the debates? Building a wall. Hillary Clinton’s e-mails. Donald Trump’s dating habits and attitudes, none of which should have been any surprise to anyone. What a joke.
Meanwhile, my member of Congress, who has been out of the news since asserting that there was still slavery in New York State in 1898, is running for re-election unopposed. If she has done anything in all her years in office, word of it has not reached me.
I suppose Senator Schumer has an opponent, but apparently not someone who has said anything of note, as I have no idea who that is. I only know Schumer is up for re-election because he has a few ads up, saying nothing of consequence.
The long time member of the state assembly in my area has successfully designated his replacement by not announcing his retirement until the day petitioning started to get on the ballot, so no election there either.
I hate to admit it, but I’m not even sure who has been assigned to pretend to represent me in the State Senate. Whoever it is, they have never been heard from.
This is a society in decline. And the only real issue in this election is which tribes of people in Generation Greed will profit the most from one more score at the expense of a future they don’t care about, and those who will live in it.
American Community Survey Data: Falling Median Work Earnings by Educational Attainment 16 Oct 2016 6:48 AM (9 years ago)
As I noted in my prior post,
The American Community Survey: Economic Changes from 2005 to 2015
the business cycle, with expansions and recessions, means that comparisons over time for data items such as work earnings and income are only meaningful if one compares economically similar years. The press reports an increase in inflation-adjusted work earnings from 2014 to 2015, but that is merely what should be expected in an economic upturn. A comparison between 2005 and 2015, on the other hand, shows falling median earnings over the business cycle. As a follow up, with economic trends for U.S. men compared with women, and less educated workers compared with more highly educated workers, an issue in the Presidential election, I downloaded some additional American Community Survey work earnings data to see that the actual situation is – in the U.S., NYC, and nearby areas.
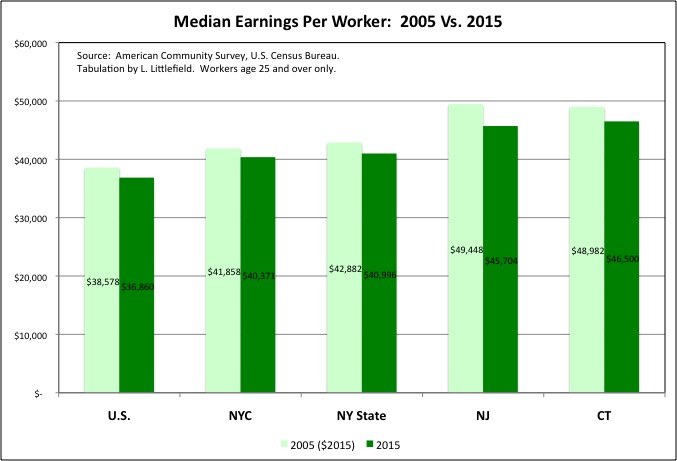
In my prior post, I found that when 2005 (adjusted for inflation into 2015 dollars) is compared with 2015, a similar year with regard to the business cycle, one finds that the inflation-adjusted median work earnings of workers has fallen – by 5.2% for the U.S., 4.8% for New York City, a stunning 8.8% in New Jersey, 6.8% in Connecticut — and 5.4% for New York State as a whole. (I can’t calculate a median for the “Rest of New York State,” but given that the drop in the state as a whole is much higher than the drop for NYC, clearly the drop for the portion of NY State outside NYC is higher still).
That data was from table DP03, Selected Economic Characteristics, and was for all workers. The data to follow is from tabulations of median earnings by educational attainment, and only includes workers age 25 and older. The data I downloaded to produce the following charts is here.
In each case the data is for workers by place of residence: the New York City data is for workers who live in the city, not for those who work in the city, many of whom commute in from the suburbs. And it includes not only wage and salary workers but also self-employed workers: business owners and partners, freelance workers, contract workers, informal day laborers who answered the survey.
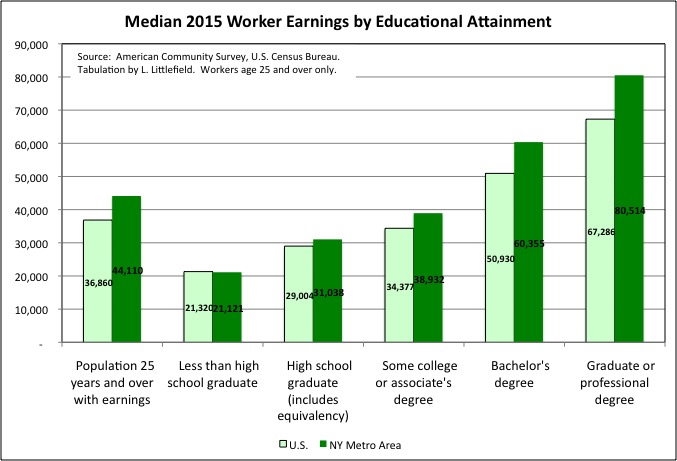
Based on the Census Bureau’s median work earnings by educational attainment cross-tabulation, one finds that as expected the median annual work earnings of workers with higher educational attainment is higher than that median annual work earnings of workers with lower educational attainment. And the median annual work earnings of those living in metro New York in 2015, at $44,110 according to American Community Survey data, was higher than the U.S. average, at $36,110. But the extent to which metro area workers earn more than the U.S. average varies by the extent of their schooling.
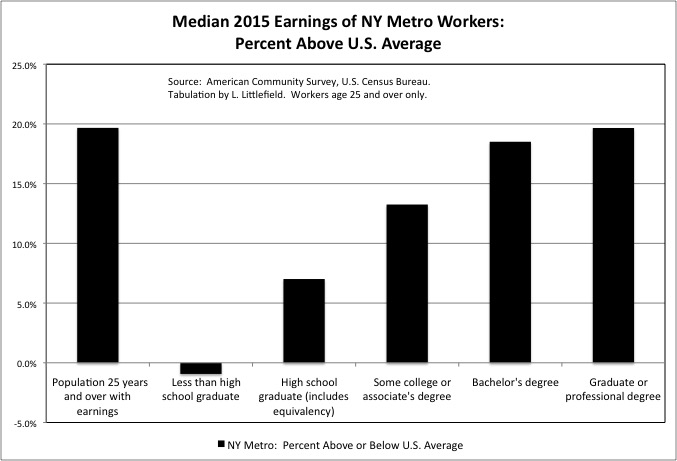
Overall, the median NY metro area worker earned 19.7% more than the U.S. average in 2015. But among those with less than a high school diploma, the median earnings in metro New York was actually less than the U.S. average by $21,121 to $21,320. For those with a high school diploma alone, the median for metro New York residents was just 7.0% higher than the U.S. average, at $3,1028 to $29,004. For those with some college or an associate’s degree, the median for metro New York was 13.3% higher at $38,932 to $34,377. For college graduates, the median for metro New York was 18.5% higher at $60,355 to $50,390. And for those with graduate degrees, metro the median for New York was higher at 19.7% higher at $80,514 to $67,286.
How can the median earnings for all workers living in metro New York be 19.7% higher than the U.S. average, when the median for every educational category other than those with graduate degrees is higher by less than that? Because a higher share of workers living in metro New York, relative to the U.S, are in the higher educational categories. Metro New Yorkers earn more that other Americans, on average, in part simply because they are more highly educated, not just because they live in Metro New York. And given the high cost of living in metro New York those with the less education, and earning less or barely more than they would elsewhere, will clearly struggle.
Recall that the median is the middle worker if they are ranked in order, not what is usually referred to as the “average,” namely the mean. The mean would be a little higher, because of the concentration of workers at the top. And this is the median for all workers, including those who only worked part of the year or part time. The median for full-time, year-round workers would be somewhat higher.
Still, for comparison with, for example, the relative pay levels of public employees, it is fair to say that the typical worker earnings in metro New York is 20.0% higher than the U.S. average. The typical adjustment to I make to NYC local government pay and spending, using mean payroll per worker for those working in Downstate New York’s private sector excluding the Finance and Insurance sector as the factor, came in at 26.4% higher than the U.S. average for 2014.
Because metro area boundaries change with each decennial census, I can’t compare the median earnings of NY metro area workers for 2015 with 2005. So instead I make that comparison for the U.S., New York City, New York State, New Jersey and Connecticut.
The data show that when adjusted for inflation the median earnings of workers fell in each of those areas from 2005 to 2015. Based on the business cycle alone one might have expected median earnings to be higher in 2015, five years after the bottom of the Great Recession in 2010, than in 2005, just three years after the previous recession hit bottom in 2002. But the reverse it true – median earnings were higher in 2005 than in 2015. One expects median earnings to rise in booms, and fall in busts. But this data shows that median earnings fell over a cycle.
There was no between-census American Community Survey prior to 2005, but based on other data I have seen (Current Population Survey, Survey of Income and Program Participation) or read about in the media, the trend of falling earnings per worker goes back much farther. With the median earnings at the peak of the most recent cycle in 2007 lower than in the census year of 2000, the peak of the cycle before. And the median earnings in 2010, the low point of the most recent cycle lower than in 2002, the prior low point. In fact I believe that median earnings were lower in 2005 than in 1995, lower in 1995 than in 1985, and perhaps even lower in 1985 than in 1975, though in the latter case I’m not as sure.
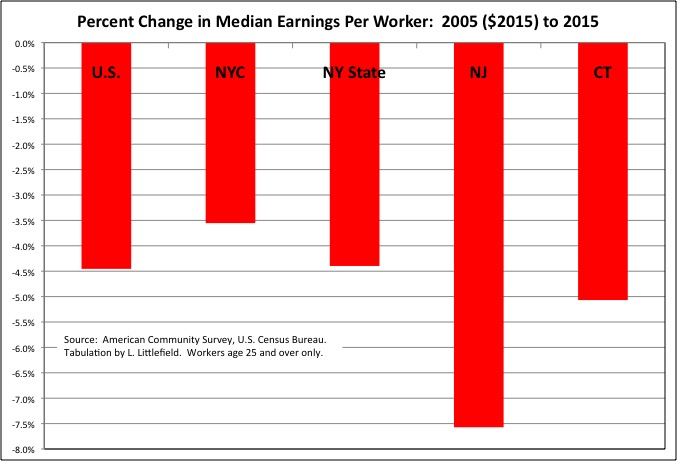
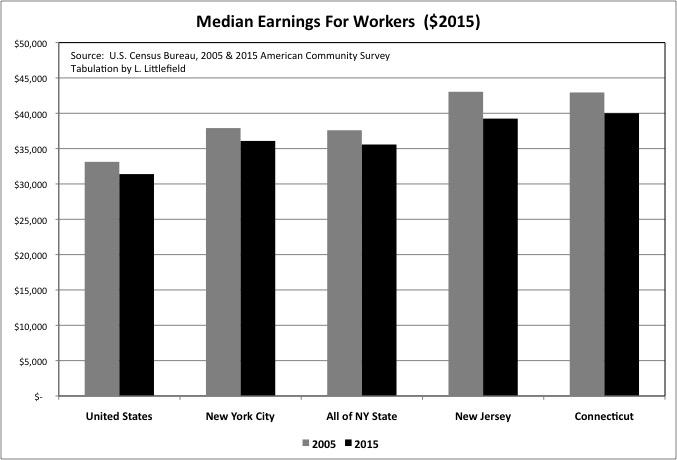
The median earnings of workers living in New York City fell 3.6%, adjusted for inflation, from 2005 to 2015 – from $41,858 to $40,371. That was actually a relatively strong performance for those ten years, as it has been for NYC based on other economic data as well. The decrease for New York State as a whole was 4.4%, from $42,882 to $40,996. The U.S. decrease was 4.5%, from $38,578 to $36,860.
I can’t calculate a median for the “Rest of New York State” as I could with a mean, but since the median earnings for NYC residents fell by less than the statewide average, one can assume that the median earnings for the Downstate suburbs and Upstate NY fell by more than the statewide average. After all New Jersey and Connecticut took bigger hits than NYC, with the median earnings of Connecticut workers falling 5.1% to $46,500 and the median for New Jersey workers down a stunning 7.6% to $45,704.
There were many workers who lost their jobs in the Great Recession who ended up taking jobs for far less thereafter. But a decrease in median earnings doesn’t have to be caused by the earnings of individual workers going down. It can also be caused by a generational shift.
The generations born between 1930 and 1957 or so, the so-called Silent Generation and the first half of the Baby Boom, were the richest in U.S. history at each point in their lives. Working in 2005, many were retired by 2015. Those workers in the generation to follow, who had moved into the pre-retirement years by 2015, likely had lower earnings than those who were at that same point in their lives in 2005. And those entering the labor force in 2015, as well, were likely worse off that those who entered the labor force in 2005, who were in turn worse off than those entering the labor force in 1995, etc.
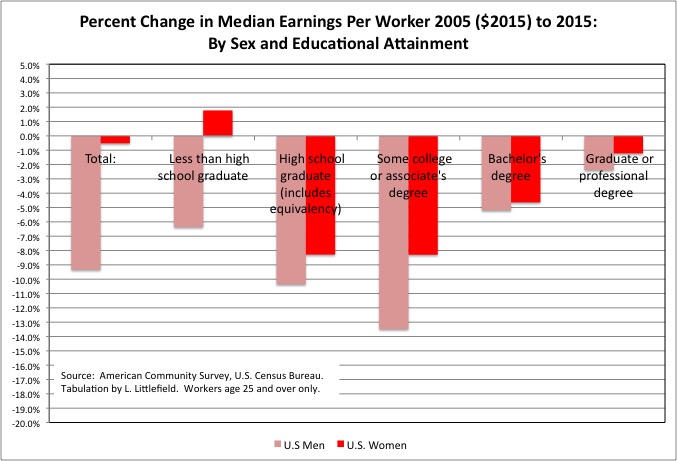
Looking at data for the U.S. as a whole, the median earnings of male workers did fall much more sharply than the median income of female workers. The median earnings of male workers fell a stunning 9.3% from 2005 to 2015, while the median earnings of female workers fell just 0.5%.
The only reason things weren’t worse for working females, however, was their average education attainment was higher in 2015 than it had been in 2005. When you look at each education level individually, the median earnings of females generally fell nearly as much as those of men. The exception was workers without high school diplomas. While the median earnings of U.S. men in this category fell 6.4%, to $25,159, the median earnings of women actually increased 1.8%, to albeit to just $16,151. Perhaps because they worked more hours on average in 2015 than they had in 2005.
Among U.S. workers with a high school diploma, median earnings were 10.3% lower in 2015 than in 2005 for men, and 8.3% lower for women. For those with some college or an associate’s degree, median earnings were 13.5% lower for men and 8.3% lower for women. For those with a college degree, it was 5.2% lower for men and 4.6% lower for women. And for those with graduate degrees, it was 2.4% lower for men and 1.2% lower for women.
Let me rehash earnings history as I have come to understand from other sources. Starting with the back-end of the Baby Boom, each generation of Americans has been paid less than the one before, adjusted for where they are in their lifecycle. The negative trend worked its way up the educational ladder, starting with high school dropouts after 1973, the year median wages for males peaked in this country, and moving on to high school graduates in the 1980s, after the “deindustrialization” recession early in that decade, and college graduates in the 1990s, after the early 1990s recession that was the first to really affect them. In the 1990s only those with graduate degrees were getting ahead, and by the 2000s it was just the “one percent.” But since the financial crisis only the .01 percent has been getting ahead, and perhaps soon not even them.
The data for 2005 to 2015 shows that even among those with graduate degrees median earnings are falling, as I would have expected. But it also shows that the median earnings of less-educated workers, which has been falling longer, is still falling faster.
Moreover the situation of U.S. women is kind of like the situation of workers in the first half of the Baby Boom, the 1960s generation, in general. Like the generations to precede them, they have been richer on average at each point in their lives than the generation before. But the Federal Reserve Bank of St. Louis has found that if you adjust for educational attainment the early boomers – like the generations to follow – in fact earned less than the richest generation – the Silent Generation born 1930 to 1946. It was only their higher educational attainment that allowed the early Boomers to get ahead. By the time of the late Boomers even that was not enough.
The same may be said of U.S. women. Their rising educational attainment and expansion into different occupations may have once insulated them from the trend of falling earnings experienced by men. But from 2005 to 2015 that was no longer the case, albeit with a mere 0.5% median earnings decrease for women during the decade.
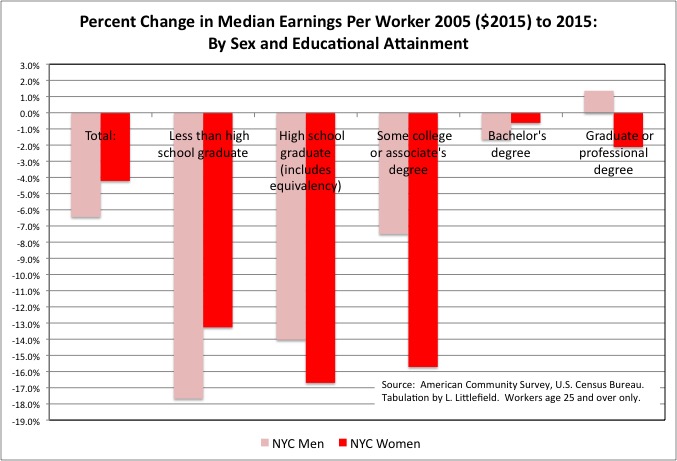
Women fared even worse in New York City that the U.S. average, perhaps because so many have been pouring into the city and competing wages down. The median earnings per worker for city residents fell 6.4% from 2005 to 2015 for men, to $42,453, and 4.2% for women, to $36,426.
For those with lower educational attainment, the NYC decreases in median earnings are huge. By 17.7% for men and 13.3% for women for those with less than a high school diploma. By 14.0% for men and 16.7% for women for high school graduates. By 7.5% for men and 15.7% for women for those with some college or an associates degree.
On the other hand, those with higher educational attainment lost less in earnings in NYC that the U.S. average, perhaps explaining why so many educated young people continued to come here despite soaring rents. The inflation-adjusted decrease from 2005 to 2015 was 1.7% for men and 0.6% for women for those with college degrees. NYC women with graduate degrees had a 2.1% decrease in median earnings, but men with that level of education managed a 1.4% increase.
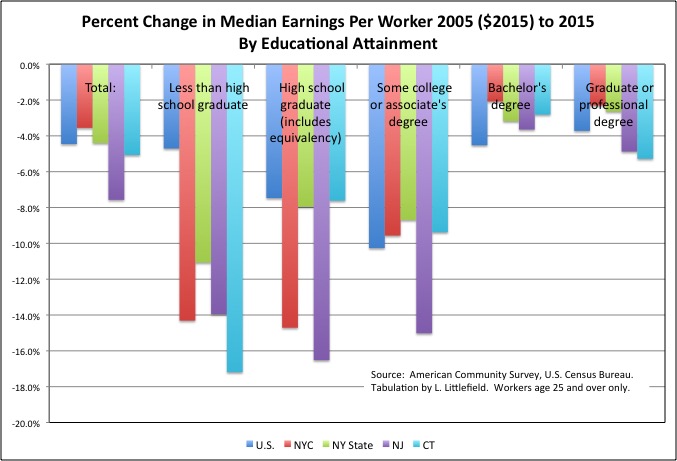
The trend of very large decreases in inflation-adjusted earnings from 2005 to 2015 for those with an associate’s degree or less, with decreases generally of 8.0% or more, was also present in New York State as a whole, New Jersey, and Connecticut. Those with college degrees and graduate degrees generally saw their median earnings fall by 5.0% or less – not by as much, but also not what people expected when they pursued and paid for higher education.
New Jersey and Connecticut stand out for the larger decreases in median earnings for their residents with graduate degrees – by 4.9% and 5.3% respectively. That is not a cyclical decline, from an economic peak to a bottom. That is an over-the-cycle, structural decline. No wonder state income tax revenues have been weak in those states, and a fiscal crisis is ongoing.
Unless there was a shift in people’s honesty in answering work earnings questions between 2005 to 2015, this data shows a massive decrease in people’s inflation-adjusted work earnings over a cycle. Perhaps when a smaller decrease happened in the cycle before that and the cycle before that, people forgot their anger when they benefited from a short-term income gain as the economy recovered. Not this time, according to what is going on in the election.
Given that the U.S. economy was for 30 years characterized by soaring debt for consumption, moreover, the decrease in work earnings underestimates the decrease in spending power and the standard of living.
http://www.bloomberg.com/news/articles/2016-04-01/the-credit-collapse-opened-the-door-for-trump-and-sanders
Even better off, more highly-educated workers who have suffered smaller decreases in work earnings over a shorter period of time may be trapped into poverty in old age by their own high spending and inadequate savings. After having spent more, they face having to spend rest the rest of their lives.
https://www.bloomberg.com/view/articles/2016-07-19/why-trump-s-prosperous-supporters-are-angry-too
Despite the fact that the workers who support them are falling further and further behind inflation the richest generations in U.S. history, those now in or close to retirement, resent the fact that their Social Security income is merely keeping up with inflation.
http://bit.ly/2ecvaj9
COLAs have flat – lined at unprecedented lows over the past 7 years, averaging just 1.2 percent a year. That’s less than half the 3 percent that COLAs averaged from 2000 to 2009.
Because inflation has been lower.
“Unfortunately this financial impact is not fully understood by the vast majority of the public and Members of Congress — The Senior Citizens League is working to change that.”
The vast majority of the working American public, however, is heading for a 25.0% cut in Social Security benefits in 2030, as a result of the debts and inadequate savings richer generations have bequeathed to them collectively. That is on top of the fact that on average their benefits would have been lower anyway, because they earned less while working.
Look beyond the business cycle, look beyond the political rhetoric, and this is the reality. Why are U.S. businesses not investing? “Uncertainty?” “Regulations?” “Taxes?” How about certainty. Who are they going to sell to? The market is shrinking as people with lower incomes are forced to pay off the debts from Generation Greed’s party.
While lower, the work earnings of U.S. workers are not low by global or historical standards. While down from its prior unsustainable level, the standard of living those earnings could buy would have been perfectly respectable and middle class 40 or 50 years ago. The problem is in part psychological, and spiritual. What seems to matter most to people is that younger generations are poorer than their parents, on average, and many older people are poorer than they once were. Those older don’t want to face their role in this. Those younger don’t see a positive future.
Unemployment is low, inflation is low, and in the short term wages are rising. But you can’t ignore the fact that the U.S. standard of living is down, big time, after decades of the advertising industry programming Americans to believe they had to spend more and more and more just to be considered middle class rather than poor.
It’s Over (Second Debate) 9 Oct 2016 7:38 PM (9 years ago)
Yes it’s over. Call it a day. Sorry that it had to end this way. no reason to pretend. (Deniece Williams and Johnny Mathis)
Hillary gets an “A” Trump a “D,” for the second debate.
Trump’s campaign is on life support. The first 15 minutes of the debate, it seemed he was almost functioning like was a zombie, perhaps that was his way of being contrite. Trump, again had issues with his sensitive microphone picking up his breathing.
Inappropriate for Trump to bring several women to the debate who have accused Bill Clinton of unwanted sexual advances. Bottom Line, the clock is winding down on Trump. Trump did nothing to build on his base or anything to cut into Hillary Clinton’s lead. In fact things are going so badly these days for Trump, the question is will he cost Republicans the Senate Majority. Trump is on the ropes.
Second debate victory win for Hillary Clinton. I got to watch it from first visiting Chicago today, and then Wisconsin.
Lessons For Trump From VP Debate 5 Oct 2016 7:43 PM (9 years ago)
Trump’s running mate, Indiana Gov. Mike Pence turned out to be a “textbook” case of how to be graceful under fire.
Pence didn’t get rattled, Pence didn’t get angry and Pence didn’t get thrown off his game.
Note to Mr. Trump. Pence didn’t have a tantrum in front of millions of undecided voters just days before an election. Pence smiled and handled inevitable attacks that are guaranteed to come in a debate, with dignity, class, and a smile.
The top of the ticket is what matters, (what voters make their decision on) however the performance by Pence, should be an example to running mate Trump of how to handle Sunday and the final debate.
Trump, could after all be elected president of the United States. Make the case. Stick to your game plan. Don’t fall directly into OPPONENTS hand.
Clinton’s running mate Virginia Sen. Tim Kaine was solid as well, but in the first 30 min, Kaine came off as too excited and too aggressive in the traditional role of the VP pick, and that is attack dog.
This is what I said on radio following the first presidential debate, and elsewhere.
Another One Bites the Dust (Part 1) 29 Sep 2016 6:46 AM (9 years ago)
Whenever I write a column putting my own spin on the abbreviation “USA”, I often proffer that it actually stands for (the) “United States of Amnesia”. This leads -at times- to responses from some readers who claim that I am being disrespectful towards the country in which I have been residing for the past forty-three consecutive years. They are wrong. I am simply expressing my observations steeped in numerous truths. To wit: that too many Caucasians living in these “not-united states” tend to display a high degree of amnesia when it comes to issues of race; wherein, in this country, caucasians (whites) treat negroes (blacks), and native-Americans (the aboriginal Indians), and Hispanics (some call them “Latinos”), and other non-white groups, in horribly inhumane, and sometimes even deadly ways. It has been continuous from the day the Mayflower landed. It has been skillfully woven -over four centuries- into both the Caucasian psyche and the very basic fabric of “Americana”; with too little generic remorse from far too many whites. And it has evolved from a “white-supremacy” mindset, which originated in Europe way back in the day.
If in this minute, you are considering that “Cousin Rocky” has finally gone off his rockers, then may I suggest a crash course in “colonialism” (Euro-style). And while you are at it, also do crash courses in these areas: “mercantilism”, “capitalism”, and “negro slavery thru the nineteenth century”.
Let me preface this column by saying for the umpteenth time: “truth by its very nature is often quite controversial”. Generally, when things get testy, truth is usually the first casualty in many a dispute or disagreement. Humans lie. They lie a lot. They usually lie when their asses are on the line. The harsher the consequences being faced the craftier the mendacity. On too many fronts, Americans have been living with lies for far too many years. It has to stop one day, otherwise we will destroy ourselves. Otherwise we will wake up one morning only to encounter a race-war. Not just some spontaneous protest -or organized waves of protests- but a full-blown race-war: worse than the Civil War of 1861-65.
Let me make this observation/conclusion public: in my estimation, most whites aren’t racist. I suspect the white-racists in our midst number around a quarter of the total white population (or slightly less). And I say this after nearly a half-century of personal observation while living here; strenuous and voracious reading and studying; a mixture of analysis and evaluation of polls and surveys; evaluating documents on the subject; reading the findings of commissions of inquiry, and other instruments of social-science with its technique(s) for information gathering; plus countless hours of human interaction; plus a tremendous number of hours trying to be a forensic historian.
I know this isn’t scientific, but it’s my honest opinion. With all that in mind however; and throughout American history; that racist quarter of the white population here, have surely made the other 75 per cent look bad: real bad. And that’s because there are too many cowards within the ranks of those “seventy-five-percenters”. Horrible things happen when good people stay silent in the face of wrong-doing.
You want to know why so many whites are cowardly: well, let me tell you. It is something similar to what is happening in police departments all over the country. Too many people refuse to see the bigger picture. They evaluate real issues in very narrow, singular, self-centered and insular ways. You see; in the USA and “todo el mundo” (all over the world), white/light skin delivers certain unique perquisites. Membership in the Caucasian race surely has its privileges. Here is the “root of the root, in a tree called the reality of life”: too many caucasians vehemently deny that white-skin has significant universal benefits in every single area of human endeavor, when compared to non-whites. Too many prefer to stay silent and quietly reap some of these benefits of having light skin; while knowing fully well that these advantages are unfair and unjust; especially in the realm of economics.
One of the reasons for this pervasive white-denial is subsumed in a narcissistic desire to maintain their phony subscription to the mantra that “all men are created equal”: as some sort of philosophical or moral high perch on which they try to hang there cerebral hats. And if you don’t believe this, then explain to me how the founding fathers (many of whom owned slaves) could cloak their constitution -which on some levels attempted to justify their treason- in so many idealistic terms. And they did this while simultaneously proposing that Negroes be counted only as part-human. They all ratified a document that helped take the inhumanity of slavery to more subtle forms of indecency, brutality, oppression, immorality and the like.
In this country, a first-cousin of “lying” survives and thrives. That first-cousin’s name is: “hypocrisy”. I posit that the founding fathers were a bunch of friggin hypocrites. Yes; there were some great men amongst the bunch -with tremendous personal accomplishments on their resumes- but collectively: they were all hypocrites. Individually; maybe Benjamin Franklin was a possible exception; maybe.
All this brings me to this column.
And as I start this column it has been ninety-five hours since an unarmed black man was shot to death by a white cop in Tulsa, Oklahoma: “another one bit the dust”. Videos from the sordid event show that he (Terence Crutcher) had both hands in the air in a sign of surrender. Word on the street is that the white female officer, who shot him, claimed that she felt he was reaching into his car window (for a weapon or something). Problem with that is this: videos recorded by their very own officers, show that the car-window was closed. There is no evidence of Crutcher doing anything illegal. Well; nothing beyond maybe not complying with certain orders in a timely manner. News reports so far, shows that nothing has emerged to suggest that he did anything illegal enough to warrant his demise.
Let me go further.
As I start this column it has been ninety five years since hundreds of black men (and women) were murdered by whites in the same city; and in the famous words of sports-philosopher Yogi Berra: “it’s de-ja-vu all over again”. And after all the changes, things are still more or less the same.
Go on the internet and look up “Tulsa; Oklahoma (May 30th thru June 1st, in the year of 1921)”. In the past, whenever I ventured into this event during some of my political science lectures, many a white student would be visibly upset since they knew nothing about it singulair asthma. A few actually challenged my veracity. And as I have said umpteen times over the years: “truth by its very nature is controversial”.
The events that transpired over those three days, in a district known as Greenwood, in the city of Tulsa, in the state of Oklahoma, back in 1921, is just one of thousands of historical facts deliberately buried by those white-gatekeepers of the history generally taught in public schools. Look up “Rosewood, Florida: 1923” while you are doing this research assignment. I am certain that many of those right-wing-whites (usually registered “republicans”) who just love to wave that “confederate flag” at public events, would be embarrassed beyond belief, were one-tenth of their ancestor’s inhumane actions, to be enumerated and elaborated on, for the world to see, hear and read.
The only thing new about police-misconduct today is this: with the advent of exploding communication-technologies, exposure of their pervasive and prolific bad-behavior, has been captured on film by John Legend’s “ordinary people”. Those apologists who have stubbornly resisted objectively evaluating the billions of complaints over centuries, from those (especially non-white) who bravely spoke out against the immorality, the inhumanity, the lying, the brutality, the framing, the thievery, the injustice(s), the terror, and sometimes the outright murder, et al, that have been committed over centuries; are suddenly forced to stop in their tracks and rethink everything the held sacred about law-enforcement officials. Why? Because of a preponderance of visual evidence; that’s why.
Every time you turn around nowadays, someone somewhere in this country has captured on film, very questionable actions of police-officers, when film is compared to physical or verbal reports officially filed. Consider this folks: if there weren’t cell-phone cameras and other types of sight and sound-recording-devices , could you imagine how many of these cops will have gotten away scot free with the crimes they committed. Well consider this further: long before cell-phones and other such devices were common place, thousands of cops did just that: “get away with murder”.
Let me give you a synopsis of what transpired in Greenwood, Tulsa, Oklahoma, back in 1921. It was a Monday (Memorial Day). A young white female alleged that a young black man -who she knew on a personal level- behaved indecently in an elevator. Law enforcement officials arrested this young man. They took him to a police precinct. There are conflicting views on what actually transpired when these two young adults encountered each other in that elevator; and I said before: “truth is usually the first casualty” in these types of conflict.
Let me go a little further back in history. Oklahoma was granted statehood on November 16th, 1907. Many blacks had moved there from the South after the Civil War. This was done mainly because many of those rebellious-whites, who had lost the war, were openly seeking reprisals and terrorizing blacks like nobody’s business. Lynchings were common place. The “Klu Klux Klan” was in full bloom. Whites would have “picnics” wherein they would “pick” a “nigger”to lynch, while scores of whites (men, women and children included) will watch and cheer. Law-enforcement figures were openly complicit in many of these atrocities.
Going further back, we will find that in 1919, in a town called Elaine, in the state of Arkansas, close to three hundred black sharecroppers were slaughtered by whites just because they attempted to organize themselves and protest the exploitation of white landowners. The unofficial count goes as high as eight hundred dead blacks. This happened because the local sheriff (Frank Kitchens), in attempting to prevent the organization from taking further roots, deputized a large number of white men (forming a quasi-militia). This group systematically went about the carnage, by roaming the area and killing blacks on sight, for at least three whole days. Eventually, the governor sent in federal troops.
Not a single white man was charged in this massacre. Less than half a dozen whites were killed by those trying to defend themselves. One hundred and twenty two blacks were arrested. Seventy three of those were charged with murder. Many were convicted. Some convictions were overturned in appeal. If you research this topic you will be fascinated by the legal struggles of those blacks who were incarcerated. You will be pained by the illegalities, excesses and abuses by white law-enforcement officials, and many whites employed within the justice system. Even the US Supreme Court had to eventually weigh in on this debacle.
Now back to Oklahoma two years later. In the section of Tulsa, called Greenwood, blacks had managed -despite tremendous odds against them- to develop a thriving community of merchants, skills-men, tradesmen and professionals. Black-owned businesses were blooming. It was called the “Black Wall Street”. It was probably the wealthiest predominantly-black community ever developed by blacks mainly, in the history of this nation. Unemployment here was almost non-existent. Blacks were -in general- quite industrious and prosperous. They had developed schools, churches, medical facilities, stores and other thriving business entities, unparalleled by any other black community then. Expectedly, there was white-resentment from neighboring communities where caucasians were somewhat baffled at the successes of these “niggahs”in the post-World War 1 era.
When a rumor spread in the black community that the young man who was arrested that Memorial Day back in 1921, would be lynched without a fair trial; blacks gathered by the score(s) outside the police precinct. It is alleged that their collective-intention was to set him free. Word spread in surrounding white communities, and thus a match was lit to an already volatile situation. Rioting ensued. Shooting, pillaging and terror reigned for at least two days. When the smoke cleared, you will find that the black population took a heavy toll in vastly disproportionate ways.
Law enforcement officials -who were predominantly white- sided with the white aggressors of course. It was probably the first time in this country’s history wherein local government officials decided to drop bombs on black civilians. It wasn’t the last time. Go research what happened to the “MOVE “people in 1985; back in Philadelphia, Pennsylvania. In that event 11 blacks were killed by law-enforcement officials. Sixty five black-owned homes were destroyed by fire-bombing also.
In the 1921 Tulsa riots, thousands of black residents were detained by law-enforcement officials; and just like in Elaine, Arkansas, there is no official record of even a single white person being arrested, charged or prosecuted: not one. Some estimates say that over a thousand blacks were killed; others say that thousands of blacks were injured back there. We know for a fact that hundreds of black-owned businesses were burned to the ground. We also know that thousands of black-owned homes were destroyed. In 2001, the Tulsa Race Riot Commission recommended reparations for blacks who were survivors of this event. They also recommended compensation for descendants of those blacks who were wronged by this cataclysm. It took eighty years for some semblance of justice to prevail.
What too many citizens here refuse to digest is the fact that too many “Tulsas”, “Rosewoods” and “Elaines” have occurred all across this nation’s physical land-mass, and also across its “true” history. It’s time for the history books to reflect the savagery of slavery, “Jim Crow” and also “white-racism”. It’s time for this nation to deal with white-skin privilege and its zillion slights, stings, jabs, stabs, hurts and wounds, which are routinely inflicted on non-whites daily.
How quickly do we forget that it was law-enforcement officials who tracked down runaway slaves and brought them back to death or worse (yes!!). The same white cops who routinely assassinate blacks nowadays, oversaw black slaves having their limbs removed for as simple a thing as trying to learn to read the Bible, or for learning to write English. Back in the day -in more US cities than you can imagine- Negroes couldn’t even go to public schools without whites blocking the entrance(s) with guns and other intimidating weapons. Forget voting or trying to register to vote. As a black male, you better not look at a white female in any way(s) that could be interpreted at covetous (go research “Emmitt Till”). You rode in the back of the bus. Even right here in New York, city cops enforced racist laws in an unjust and unequal system. Although a lot has changed, some things still remain. Look up Elizabeth Jennings while you research. That’s another fascinating story for your personal political and historical edification. A story more fascinating than the story of Rosa Parks even: and about 100 years earlier.
How quickly do we try to forget that the descendants of these very white-racists of past years still live today: too many with the same anachronistically vile world-views on race, akin to those views their forefathers propagated. Too many of them are filling the ranks of law-enforcement-officials all over the country; too many of whom listen to the Bill O’Reillys and Sean Hannitys of the media world. Two of many whose shallow-analysis on race matters often hurt more than help; and who command large audiences nationwide. There are too many law-enforcement officials who are just plain un-educated and poorly trained. Too many of them are simply devoid of compassion. Get back to my “Fergusson” column folks: same old, same old.
Let me close out by repeating something I have stated many times in the past. Racism isn’t the only factor behind continuous police-misconduct. Ostensibly, something happens to the brain(s) of individual men and women, when they join armies, navies, air-forces, militias, police-forces, legitimized security forces, and the like: and this is a universal phenomenon. Psychologists and psychiatrists should be doing overtime trying to figure why too many in this ilk seem to be corrupted by whatever little power is placed in their hands. Quelle dommage!
Stay tuned-in folks. I’m not finished yet.
The American Community Survey: Economic Changes from 2005 to 2015 28 Sep 2016 8:09 AM (9 years ago)
Data from the U.S. Census Bureau’s American Community Survey (ACS) data was released a couple of weeks ago, and I’m surprised how little coverage of its findings there has been in the media. Most of what I have read, moreover, compared 2015 with 2014, or with 2010, and finds that the economy is getting much better for many Americans.
That, however, is not a meaningful comparison if one is looking to the long term, or trying to explain why so many Americans feel so much worse off. One would expect that people would become better off in the recovery from a deep recession, or worse off in the aftermath of the peak of a bubble. Politicians, seeking to make points for their sides, often base their talking points on data from such non-comparable years, but that is disingenuous. As it happens, there are enough economic similarities between the first year of American Community Survey data, in 2005, and the latest year, 2015, to make a comparison between them meaningful. What follows is a discussion, with 26 charts, of the economic trends I found most interesting from that comparison – for the United States, New York City, and New York State, New Jersey and Connecticut. Let’s take a break from the fantasy and deception of politics and look at some reality.
The data is taken from the “Selected Economic Characteristics” summary tables of ACS data, as found on American Factfinder.
http://factfinder.census.gov/faces/nav/jsf/pages/index.xhtml
The summary tables DP01 to DP04 are not yet front and center on this site for 2015, but one can find them by selected the ACS for the data source and searching for them. “Selected Economic Characteristics” is DP03. A spreadsheet with the data as downloaded, and “output” table comparing 2005 with 2015, and all the charts used in the rest of this post, is here.
Someone else looking at the output table might find other trends of interest that I have not chosen to highlight. That table includes everything. And it wouldn’t be that hard to use American Factfinder to download and compare these places using the Democratic, Social, and Housing characteristics data or to compare individual NYC boroughs or other areas. In any event, my quick and dirty discussion follows.
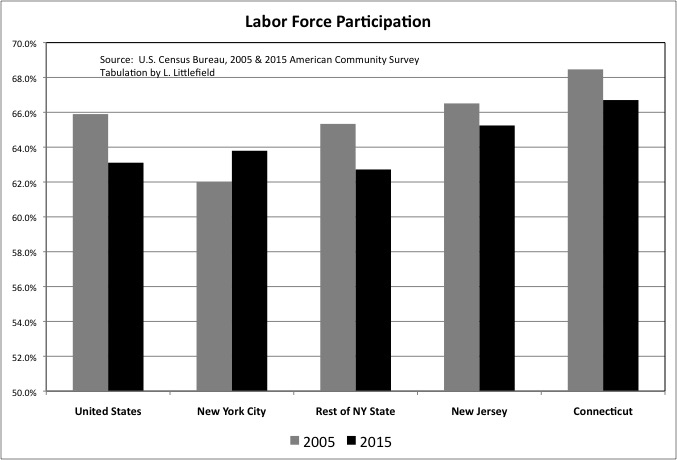
One of the most discussed trends of the past decade has been the decline of labor force participation, as the large Baby Boom generation retires and many long-unemployed workers give up looking for jobs and drop out. ACS data shows New York City bucked the trend and now, after decades of having a reputation as a place where people lived off the government rather than working, has a higher labor force participation rate than the rest of New York State and the U.S. as a whole, while still trailing New Jersey and Connecticut. Note that this data, and the rest, is by place of residence, for those living in NYC not all those working in NYC.
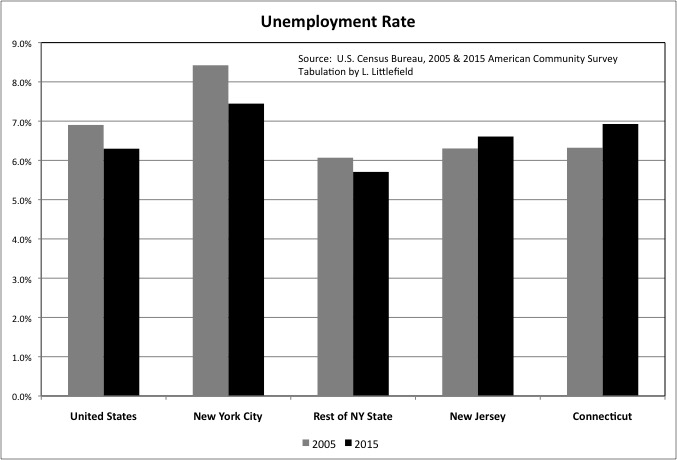
Falling labor force participation has taken the gleam off a falling unemployment rate in the U.S. as a whole, since the share of the population actually working is still lower. Nationally what used to be called the “misery index” – inflation plus unemployment – is at an all time low, but people are still miserable for reasons discussed later. Unemployment, moreover, was higher in 2015 than it had been in 2005 in both New Jersey and Connecticut.
The self-reported unemployment of the ACS is always higher than the official unemployment rate reported by the Bureau of Labor Statistics. The BLS will count you as out of the labor force, rather than unemployed, unless you are taking specific steps to find a job.
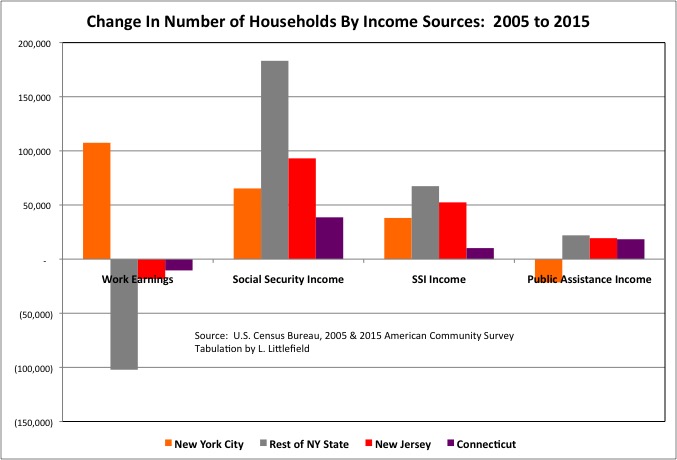
With more city residents active in the work economy, the number of NYC households with earnings from work was more than 100,000 higher in 2015 than it had been in 2005. In the rest of New York State the number of households with work earnings was lower by 100,000, with smaller decreases in New Jersey and Connecticut.
Showing the impact of aging boomers, the number of households with Social Security (old age) income increased by 22.9% in the United States, compared with 9.1% in New York City, 14.9% in the Rest of New York State, 10.7% in New Jersey, and 10.4% in Connecticut.
More and more households are collecting Social Security disability income (Supplementary Security Income — SSI) as well, in part because many aging workers are no longer economically active but have not yet reached the age for old age Social Security benefits. The number of households with SSI income increased by 49.2% in the U.S., compared with 18.3% in New York City, 43.4% for the Rest of New York State, 55.6% for New Jersey, and 49.2% for Connecticut.
Meanwhile, the number of New York City households with income from traditional “welfare” sources was lower in 2015 than it had been in 2005, extending the decline of the prior ten years.
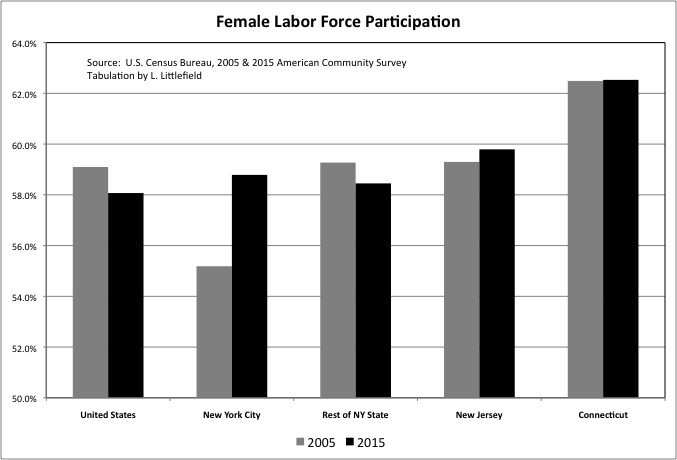
Just as today, prior to the 1960s New York City adult residents had also been more likely to be active in the workforce than the U.S. average, and the key reason was that NYC women were more likely to work outside the home. So it is no surprise that a surge in female labor force participation has been a big factor in the city once again having a higher labor force participation rate than the U.S. and the rest of NY State. NYC women still trail those in Connecticut and New Jersey when it comes to working and seeking work outside the home.
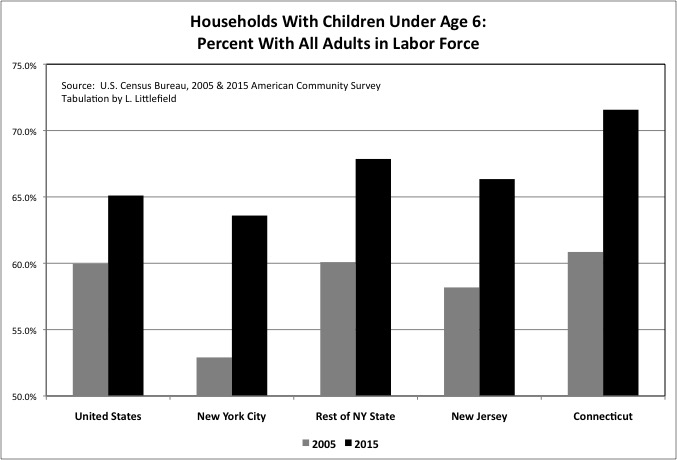
While more and more boomers head off to long retirements younger generations will never see, the share of households with children under age 6 that have all adults in the workforce continues to rise. New York City, in particular, had a huge increase, one reason that city parents presumably appreciate the city’s universal pre-school program.
The gap in labor force participation between pre-school parents and those with school-age parents (ages 6 to 17) is closing, though it has not closed completely. In the U.S. as a whole 65.1% of households with children under age 6 have all adults in the labor force, compared with 70.3% for those with children ages 6 to 17. For NYC the figures are 63.6% and 66.9% respectively.
The increase in labor force participation by pre-school parents surprises me, because I recall reading that millennial women (not to mention men) are more likely that the Boomers to stay at home with the children. Perhaps that trend is only a reality for affluent people known to the media, with everyone else having to do more and more work by necessity.
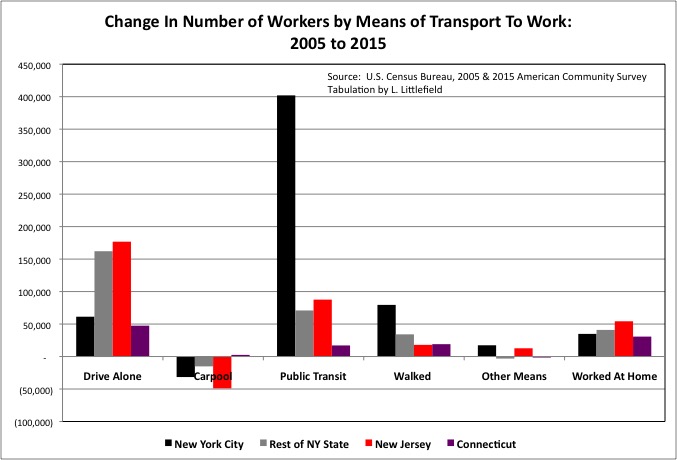
Millennials famously are more likely to have a preference for an urban, non-driving lifestyle compared with prior generations, and the share of workers driving alone to work was somewhat lower in 2015 than it had been in 2005 in the U.S. as a whole and throughout the Northeast. Even with that lower share, however, with the total number of workers rising the number of NYC residents driving along to work still increased by 61,300 in absolute numbers, with larger increases in the Rest of New York State, New Jersey and Connecticut.
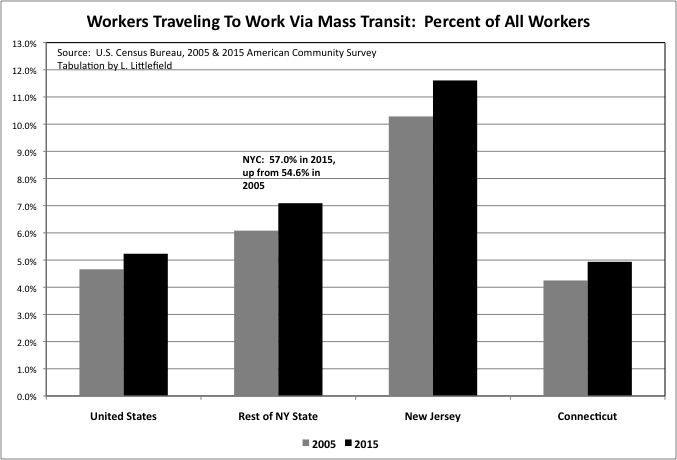
The preferences of today’s young adults mean that the share traveling to work by mass transit is rising in the U.S. as a whole, around the tri-state area, and in much of the country. Even as transit service is being gutted due to soaring public employee pension costs, past debts, and inadequate past infrastructure investment left behind by more affluent, preceding generations.
In New York City, where 57.0% of resident workers used mass transit in 2015, the number doing so was up by 402,000 from 2005. The NYC percentage is too high to show on the same chart as other areas. It is likely that many of the additional workers residing in the Rest of New York State, New Jersey and Connecticut and using mass transit (up 70,900, 87,600 and 17,100 respectively) are traveling to jobs in NYC, although reverse transit commuting and transit commuting within the suburbs have also increased.
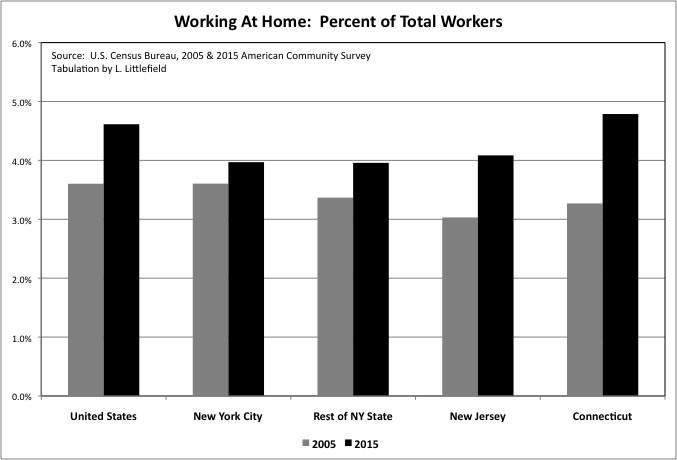
An increase in working at home is another trend associated with younger generations and internet technology, but in this case the data shows NYC trailing the U.S. and Connecticut and merely matching the Rest of New York State and New Jersey. It turns out that many seek the social aspect of working, one reason that even independent workers are renting workspaces from growing companies such as WeWork.com.
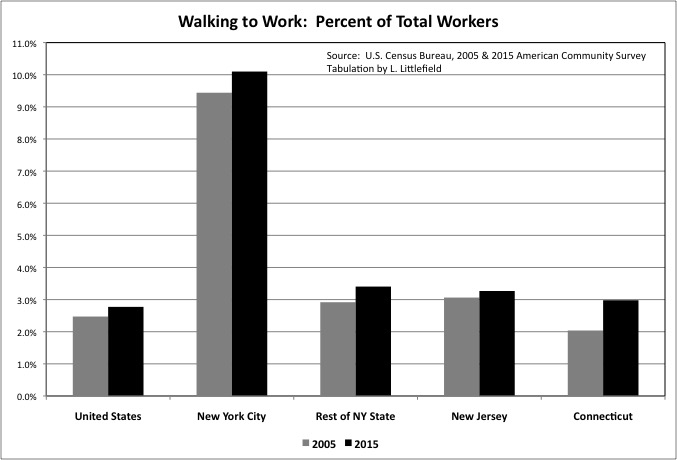
The share of workers who are walking to work is also on the rise, albeit to only 3 percent of workers in most places. In New York City, whose density puts more job opportunities in walking distance, more than 10 percent of all workers now walk to work.
One “dog that did not bark” involves the number of people using “Other Means” to travel to work, which would include both Uber and Lyft (and other taxi and car services) and bicycling. This increased by just 17,300 in New York City from 2005 to 2015 according to ACS data, while falling in the Rest of New York State. Riding a bicycle at a moderate speed requires about the same amount of effort as walking, but is times as fast. That means that three times as many destinations are within bicycling distance as are within walking distance at the same travel time, and bicycling should, in theory, be three up to three times as popular as walking.
As for the Uber boom, for nearly all workers the cost of a paid taxi ride is too high to be used for a regular commute, App or no App. Uber and Lyft, in my view, are only useful for the wealthy and for non-work trips.
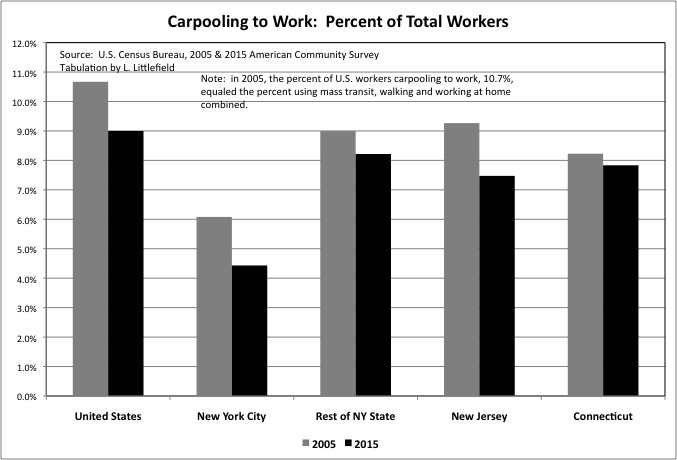
What is affordable to the middle class is carpooling, but for this type of commuting the trend is decidedly negative and has been for decades. To put the importance of this in perspective, 2005 the share of U.S. workers that traveled to work via carpool, at 10.7%, was still as high as the share traveling via mass transit and walking and working at home put together. By 2015 only 9.0% of U.S. workers traveled to work via carpool, and the share doing so fell in the Tri-State area was well. In the suburbs, where most Americans live and densities are too low for economically and environmentally efficient mass transit, carpooling and bicycles are the most realistic alternatives to driving alone.
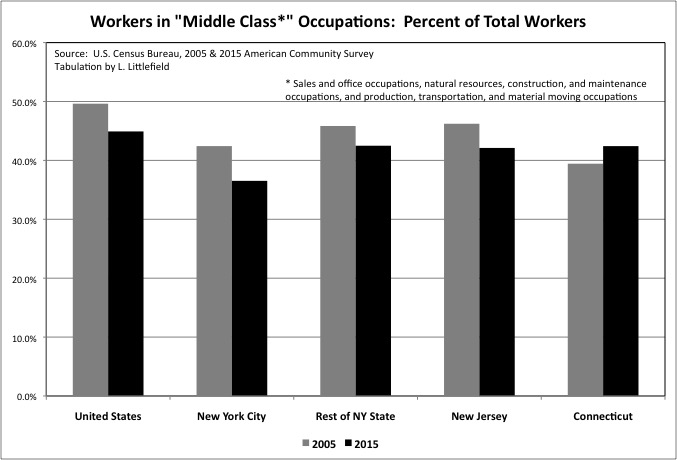
One reason for the decrease in carpooling may be the decrease in the share of the workforce in occupational categories I have grouped as “middle class”: sales and office occupations, natural resources, construction, and maintenance occupations, and production, transportation, and material moving occupations. In general these are occupations that require at least a high school education and some additional training or a college diploma, but not a post-graduate degree or some special gift. They tend to pay middle wages.
And, relevant to the decline in carpooling, they tend to provide steady, predictable schedules that allow co-workers to share rides. Fewer workers have such predictable schedules, and unpredictable schedules also reduce the ability to use carpools for non-work trips. To reverse the decline in carpooling, and thus reduce the cost of living by increasing the share of households that don’t need a car or can have just one rather than two or more, would require some form of “dynamic carpooling” that uses information technology to arrange a different carpool for every trip. I discussed this issue in this post.
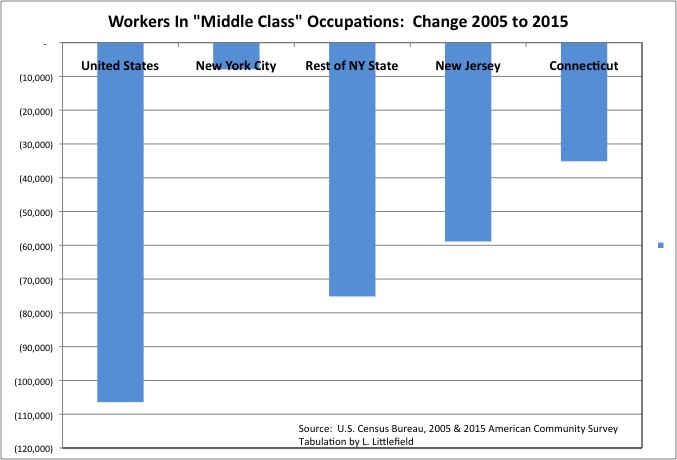
It isn’t just the share of total workers in “middle class” occupations that was lower in 2015 that it had been in 2005, it was their absolute number – by more than 100,000 in the U.S. as a whole, 75,140 in the Rest of New York State, 58,900 in New Jersey and 35,100 in Connecticut.
For the U.S. the big decrease in workers in “middle class” occupations – of more than 1 million – was in “natural resources, construction, and maintenance occupations.” Employment in the construction industry decreased due to the bursting of the housing bubble, the densification of workers in office space and falling office space demand, the rise in the internet and decrease in demand for brick and mortar retail space, and falling infrastructure investment. Manufacturing industry employment also fell, as many goods that the U.S. produces rather than imports are also linked to the maintenance and expansion of the built environment. The number of U.S. workers in “sales and office” occupations was slightly higher in 2015 than 2005, despite the advance of information technology, but it was down by 33,200 in the Rest of New York State, 66,500 in New Jersey, and 11,100 in Connecticut. .
“Middle class” jobs have been leaving New York City for places with lower labor and real estate costs for decades. Back offices linked to NYC companies, and production and warehouse operations serving NYC consumers, are often found in the surrounding suburbs. And even when “middle class” jobs are located in the city, suburbanites who commute in tend to hold them, as city residents are more likely to hold post-graduate degrees or have special talents – and are also more likely to have little education and no training at all. Due in part to a school system designed to shift some children to gifted programs and selective high schools while depositing the rest in the social landfill.
During the 2005 to 2015 period, however, the city’s economy grew fast enough that the number of city residents holding jobs in “middle class” occupations fell only slightly. It seems that only slightly fewer “middle class” people, perhaps those from elsewhere, chose to live here.
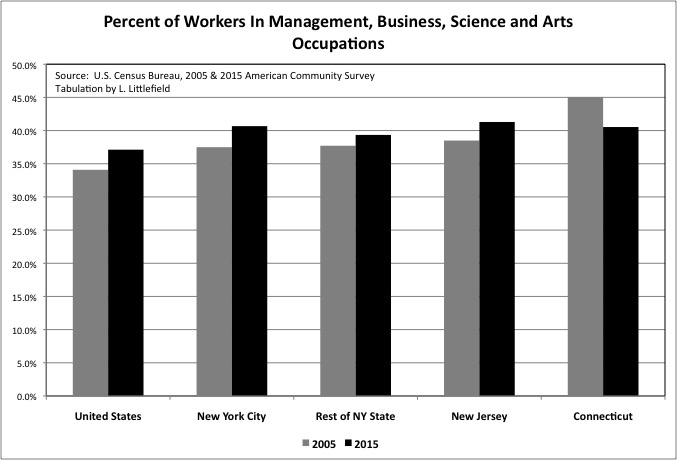
While less likely to work in “middle class” occupations, city residents are more likely than the U.S. average to work in high-skill, high-pay “management, business, science, and arts occupations.” The absolute increase in the number of NYC residents working in those occupations was 336,158 from 2005 to 2015, a stunning gain.
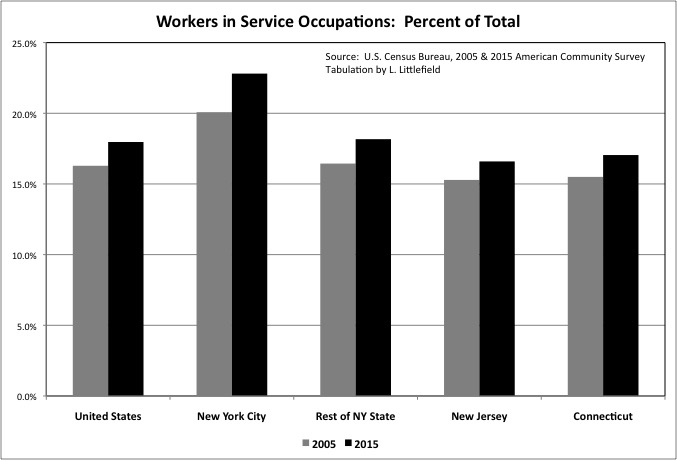
With some exceptions, workers in “Service” occupations require the least amount of education and training and earn the least amount of money. Just looking at a quick table of U.S. data from the 2015 ACS, the median earnings of workers in “management, business, science and arts” occupations was $62,255, compared with $37,397 for “sales and office” occupations, $40,928 for “natural resources, construction and maintenance” occupations, $36,820 for “production and material moving” occupations – and just $26,834 for “service” occupations. “Service” workers include “protective service” occupations such as police and fire, with the median earnings of $50,594; the median earnings in other service categories is even lower.
The share of workers in low-paid “service” occupations, like those in high-paid management, business, science, and arts occupations,” has been going up in the U.S. and throughout the Tri-State area. A relatively high share of NYC residents are in service occupations, at 22.8%. The number of city residents working in service occupations increased by 222,300 from 2005 to 2015. The direction of the U.S. economy, and even more so the NYC economy, could be described as more people and the top and more people at the bottom who serve them.
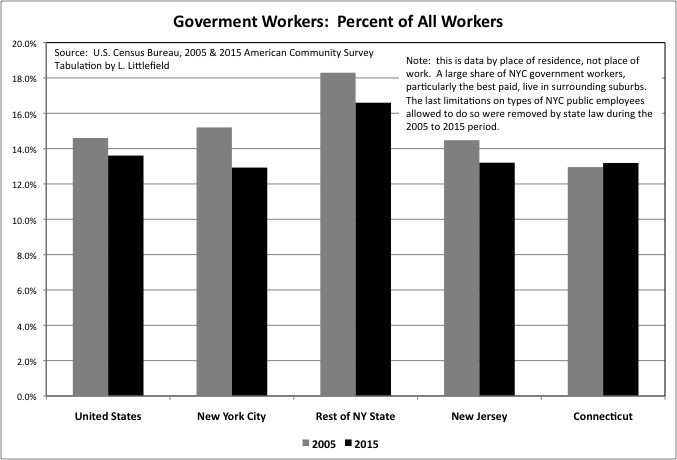
According to the Census Bureau’s “Class of Worker” data, most workers are private wage and salary earners: 80.3% for the United States, 80.4% for New York City, each up a couple of percent between 2005 and 2015. The share of workers who are government employment fell over those years, from 14.6% in 2005 to 13.6% in 2015 in the U.S. as a whole, as the soaring cost of retired public employees reduce the number of active workers taxpayers could afford. The trend of a decreasing government share of workers was repeated for NYC, the rest of New York State, and New Jersey during these years. But with slower employment growth overall, in these places the number of government workers actually fell in absolute numbers by 9,300 in NYC, 49,300 in the Rest of New York State, and 17,900 in New Jersey.
This is data by place of residence, not place of work. Government accounts for a smaller share of the employment of NYC residents, in part, because many NYC government jobs are held by residents of the suburbs. Local governments elsewhere in the state are allowed to require their workers to live in their community, and provide hiring preference for those who already live there. But the City of New York NYC has been prohibited from enacting residency requirements by New York State legislation enacted over the decades.
The first NYC public employees allowed by state legislation to live outside the city, in places with a lower total tax burden and better public services, were the best paid – teachers, police officers, firefighters, and transit workers. That was in the early 1960s, just before the crime rate soared, the transit system collapsed, and the school system also collapsed. I’d call that insider trading. Between 2005 and 2015 that privilege was extended to the rest of the workforce, with the state first allowing sanitation workers to live outside the city over the City of New York’s objection, and then the city acquiescing to a state law prohibiting residency requirements for the rest of the city’s workforce. And the share of NYC resident workers with government jobs fell from 15.2% in 2005 t 12.9% in 2015.
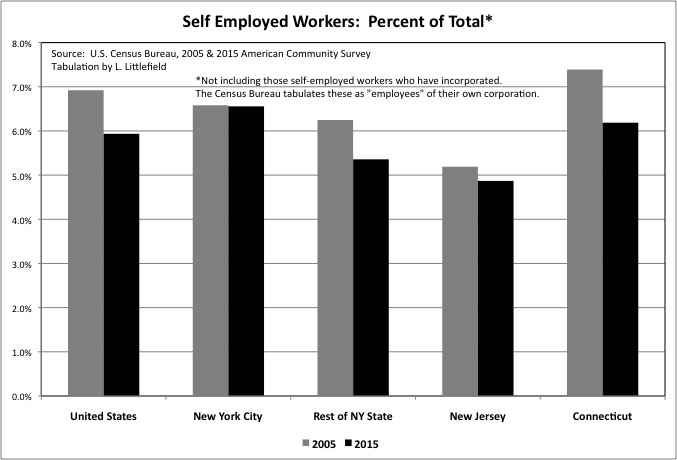
One of the much discussed labor trends of recent years has been the rise of the “gig” economy, with more and more workers laboring as freelancers, independent contractors, or entrepreneurs. According to the ACS, however, self-employed workers in the U.S., self-described, dropped from 6.9% of U.S. workers in 2005 to just 5.9% in 2015. U.S. self-employment fell by 511,000 in absolute numbers over the decade. Self-employment also dropped from 6.2% of workers to 5.4% to the Rest of New York State, from 5.2% to just 4.9% in New Jersey, and from 7.4% to 6.2% in Connecticut. Only NYC bucked the trend, with the share remaining at 6.6% (now far more than those other areas) and the absolute number rising by 35,300.
This could mean a variety of things. First, self-employment as measured by the U.S. Census Bureau has always been lower than self-employment as measured by the Bureau of Economic Analysis, based on the number of people filing IRS 2014 Tax Schedule C – “profit or loss from a business.” For thing, the Census Bureau tabulates self-employed workers who have incorporated as wage and salary “employees” of their own corporations, which may be technically correct in an accounting sense but I believe is incorrect as a matter of social statistics. For another thing those who are both wage and salary workers and self employed, a waitress who is also a self-employed actress to take a stereotypical example, is counted as both by the BEA but just one by the Census Bureau.
There is also the varying nature of self-employment. Some are self-employed because they are entrepreneurs or value the freedom of working for themselves. Others because they are powerless in the labor market and, though employees in all but name, are classified as “independent contractors” so the employer can avoid legally mandated benefits for employees, such as paying Social Security taxes and Obamacare.
In the latter case falling self-employment may be good news. Crackdowns on misclassifying employees may be working. Or, with more workers retiring and fewer unemployed, employers may have decided that locking in workers – rather than having them make daily comparisons with what they could be getting paid by other employers – may now be the employer’s interest. Whereas before they believed that paying people only as needed was better for business, because another desperate worker would always be available the next day.
It may also be, however, that entrepreneurship and creativity are on the wane, with fewer new businesses and more powerful and potentially abusive oligopolies in more and more industries. The data implies the number of new businesses with one or more employees has been falling, as I discussed here.
The American and New York Economy: Stagnation and Oligarchy or Renewal and Entrepreneurship?
So why are people unhappy if the “misery index” is low? Income.
Coverage of the 2015 American Community Survey has focused on the big increase in income in 2015 compared with 2014, a trend trumpeted by the Obama Administration. But, as mentioned, that is not unexpected in an economic recovery. The question is, what took so long?
When 2015 is instead compared with 2005, a similar year with regard to the business cycle, one finds that the inflation-adjusted median work earnings of workers has fallen – by 5.2% for the U.S., 4.8% for New York City, a stunning 8.8% in New Jersey, 6.8% in Connecticut — and 5.4% for New York State as a whole. (I can’t calculate a median for the “Rest of New York State,” but given that the drop in the state as a whole is much higher than the drop for NYC, clearly the drop for the portion of NY State outside NYC is higher still).
What if we find from next year’s ACS that there was another big increase in income in 2016, compared with 2015? In that case, the proper comparison would not be 2015 or even 2005 but rather with 2006, another year into the prior recovery. And 2017, if income is still rising, should be compared with 2007, the peak of the last economic cycle. If you look beyond the business cycle, the long-term work earnings trend is negative.
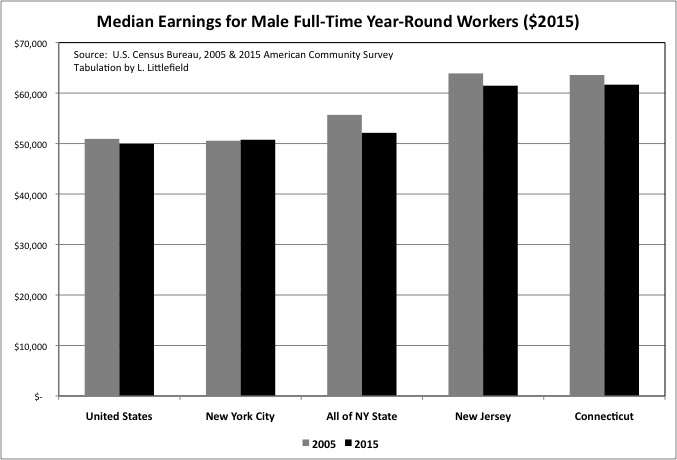
Even if the gig economy is going away, the loss of steady work still seems to be a negative for workers. For U.S. and New York City, those able to work full time rather than part time, and to avoid being idled part of the year, have not experienced as much of a decline in income. The median earnings of U.S. male full-time, year-round workers was only 1.9% lower in 2015 than it had been in 2005, while in NYC male earnings increased 0.4%. But even if male full-time, year-round earnings have not fallen that much in the U.S. as a whole, it has fallen quite a bit in many states and metro areas. The decreases were 3.8% in New Jersey and 3.0% in Connecticut over a decade.
The “Mancession” aspect of the Great Recession, with employment declines in traditionally male industries such as Construction, probably contributed to this trend. Nationally, this was partially offset by a surprising increase of 522,900 jobs in the “Agriculture, Forestry, Fishing and Hunting, and Mining” sector, driven in large part by the “fracking” boom in oil and gas production. With OPEC slashing prices, however, that boom is also now going in reverse.
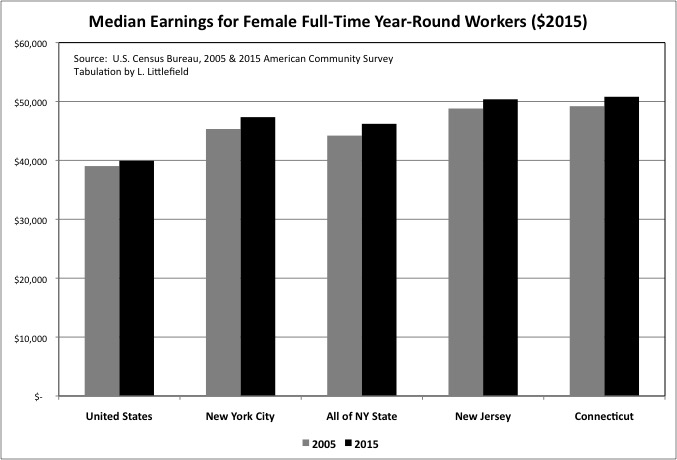
The inflation-adjusted work earnings for females working full-time and year-round has been rising long term, and also increased from 2005 to 2015. But it may be that fewer women were able to achieve full-time, year-round status. The bottom line: despite the earnings gains of women working full-time year-round, the median earnings of workers have fallen over this economic cycle. And the one before. And probably the one before that, too.
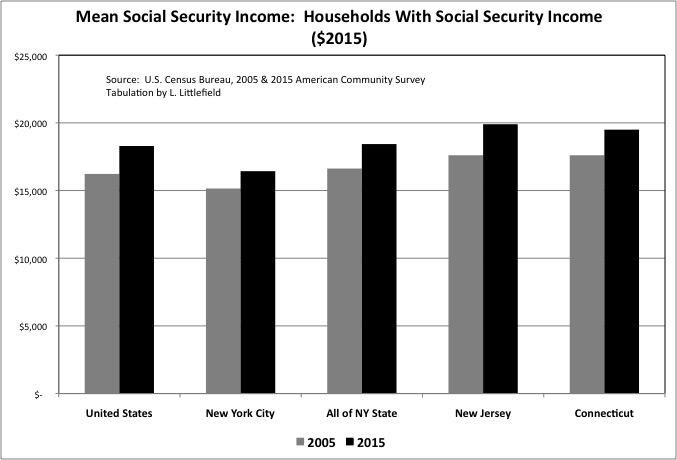
Meanwhile, the mean Social Security old age income of households who received it increased from 2005 to 2015, adjusted for inflation. During this decade members of the less well off “Greatest Generation” were dying off, and members of the “Richest Generations” – those born between 1930 and the late 1950s – were moving into retirement. Based on their higher career earnings and, for Baby Boomers, increased number of two-income workers, those now retired are entitled to receive more in Social Security benefit payments. And yet seniors have been some of the most vocal disenchanted Americans during the past few years.
Among the most recent retirees, it is likely that income other than Social Security income is falling. In part due to the zero interest rates on their savings needed to keep the value of paper assets – including their own – from collapsing. In part because they are less likely than retired members of the Greatest Generation to have a lot of savings to begin with.
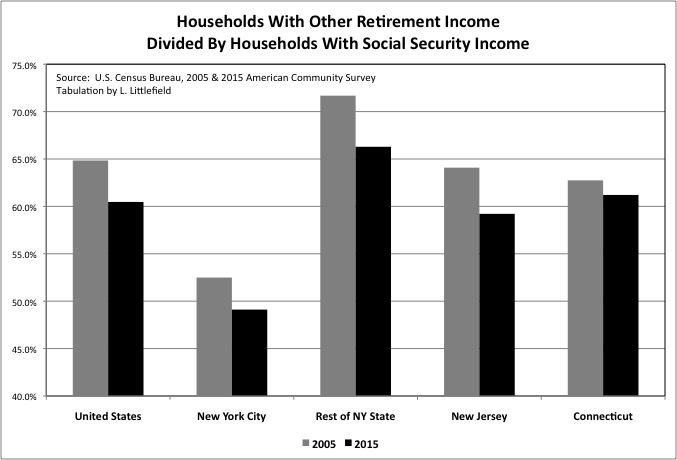
Because people can receive other retirement income, such as pensions, annuities, and 401K and IRA withdrawals before collecting Social Security, we can’t calculate the actual share of Social Security recipients that also have other retirement income. But by dividing the number of households with other retirement income by the number of households with Social Security income, we can get an idea.
It has been said that only half of current workers have anything other than Social Security coming to them when they get old, but that may not be much of a change. For the U.S. as a whole the number of U.S. households with other retirement income was only about 65 percent of the number of households households with Social Security income in 2005. Noted Robert Shiller in Phishing for Phools, not counting work income and other transfers such as veteran’s benefits, Social Security accounts for 94 percent of the total income of the 20 percent worst off people now over 65, 92 percent of the income for the next fifth in the income distribution, 82 percent of the income of the middle fifth of the income distribution, and 57 percent the income of those in the 60th to 80th percentiles. “Only for the top 20 percent is Social Security less than half of unearned income. But even for this top category, skewed as it is inclusion of the well-pensioned and very rich, it is far from a do-without; it is still 31 percent.”
This isn’t getting better, as the generations on the wrong end of multi-tier contracts reach old age. The number of U.S. households with other retirement income as a share of households with Social Security income fell from 64.8% in 2005 to just 60.5% in 2015. Presumably not because those already receiving pension, annuity and retirement account income stopped getting it, but rather because fewer recent retirees have other income compared with the generations that are dying off. Similar declines were observed in New York City, the Rest of New York State, New Jersey and Connecticut. According to Bloomberg News:
http://www.bloomberg.com/view/articles/2016-07-19/why-trump-s-prosperous-supporters-are-angry-too
Here is an unsettling statistic about the U.S. economy, although like many scary things, it reveals its full problematic nature only with scrutiny: “The Center for Retirement Research at Boston College reports that for those on the cusp of retirement – workers between the ages of 55 and 64 – the median balance in household 401(k) or IRA accounts is $111,000.” That is from the new Oxford University Press book “Empire of the Fund: The Way We Save Now,” by William A. Birdthistle, a law professor at Chicago-Kent College of Law.
These days, the 20-year retirement is extremely common, and savings must hold for longer yet for those who will live to 90 or 100 years old. For a 20-year retirement, that $111,000 in savings can work out, under plausible assumptions, to no more than $7,300 a year. And that is the median, so half of America’s older workers are in a worse situation.
This is the consequence of low savings of the past 35 years, as Americans attempted to maintain – or even increase – their standard of living even as they were paid less by their employers.
In the 1970s, a much poorer America had a savings rate that once reached 15 percent and hovered above 8 percent as recently as the early 1990s. Since then the American savings rate has fallen and has settled in the range of about 4 to 6 percent.
As for today’s 45-to-69-year-olds, only 36 percent claim to be engaging in net savings. And only 45 percent of all people earning $75,000 to $100,000 a year claim to have net positive savings, as measured in 2012. That helps explain why the typical Trump voter in the Republican primaries earned a relatively high income of about $72,000 a year and still worried about his or her economic future.
The savings problem thus is about the scarce virtues of temperament, patience, and discipline. American savings rates started to fall in the 1980s, and rising asset prices during that time set a problematic dynamic in motion. As homes and stock portfolios rose in value, many Americans concluded they didn’t have to lay aside much for their nest eggs. Asset markets would do their savings for them.
Unfortunately, the same dynamic of selling affected the political preference for tax cuts rather than setting aside the money needed to pay for Social Security when the Baby Boomers retire, or for public employee pensions.
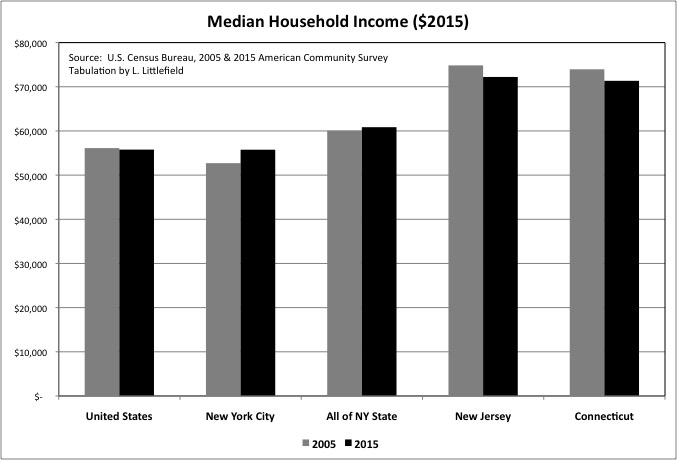
Despite both work earnings and retirement earnings falling, U.S. median household income was only slightly lower, by 0.6%, in 2015 than it had been in 2005, after adjustment for inflation. That may be because more people are choosing to live in larger households, with more income sources with only household by those doubled up with parents, children, or roommates to save money.
Median household income increased by 5.8% in New York City over those years, to about the national average (though with a higher cost of living and, in particular, housing). In New York State as a whole, however, median household income increased just 1.3%, implying a decrease in the portions of the state outside New York City. Median household income fell 3.5% in both Connecticut and New Jersey, albeit to and from very high levels.
With median household income falling slightly for the U.S. as a whole over the cycle, it is fair to assume that many places suffered decreases offset by other places with increases. Perhaps half of all Americans and American communities are worse off, perhaps more. And income doesn’t capture the decrease in spending power, because for nearly 30 years Americans had enjoyed a phony prosperity by failing to save for retirement and running up their debts.
http://www.bloomberg.com/news/articles/2016-04-01/the-credit-collapse-opened-the-door-for-trump-and-sanders
Americans lost so much in 2008 — jobs and homes, incomes and wealth — that the recession still dominates the public mood three elections later.
They lost something else too, something less talked-about on the campaign trail: a credit lifeline. For households before the crash, borrowing made good times better and hard times bearable. It held out the promise of a step up, even for the millions of working-class Americans whose wages had stalled. Paying down debt after 2008 had the exact opposite effect, amplifying the hurt and anger — and sapping the recovery.
“If you take the credit away, people are going to feel poor,” said Lucia Dunn, an economics professor at Ohio State University who led a study on household debt and the stress it caused.
Retrenchment came in two main varieties: by choice and by force. Some borrowers, seeing the devastation around them, scrounged up the cash to reduce debt. Others went bust and saw their homes go into foreclosure, or lost access to credit as banks clamped down.
In both cases, living standards took a hit. Between 2000 and 2007, borrowed money was adding about $330 billion a year to Americans’ purchasing power, according to the Federal Reserve Bank of New York. By 2009, households were diverting $150 billion to pay back debt — a swing of almost half a trillion dollars, even without counting the impact of lost jobs.
The same factors: failure to save, rising debts, and the earlier retirement on richer terms that many in older generations received – have affected entire communities with regard to state and local government, as showed in a series of posts starting with this one.
Sold Out Futures: A State By State Ranking Based on the Census of Governments
In addition to their own falling incomes, many Americans are facing increases in state and local taxes, further decreasing their standard of living, and public service cuts, reducing their quality of life. Moreover, what some are willing to admit (but others, notably Donald Trump, are still lying about) is that those born after 1957 will also face lower Social Security benefits as a result of past federal policies and their own lower average incomes.
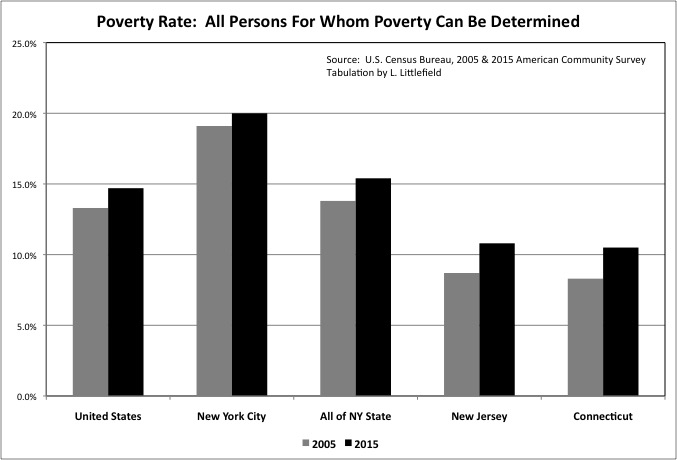
What has been true of median income has also been true of poverty. The limited reporting on the American Community Survey has emphasized the large reduction in U.S. poverty from 2014 to 2015. Given the stunning rise in poverty during the Great Recession it is certainly good that the poverty rate is falling. But look beyond the business cycle, and compare 2015 with 2005, and the real news is that the poverty rate is now higher – in the U.S., New York City, New York State as a whole, New Jersey, Connecticut, and presumably elsewhere.
The U.S. increase was from 13.3% to 14.7%, with an increase from 19.1% to 20.0% for New York City, 13.8% to 15.4% for all of New York State, 8.7% to 10.8% for New Jersey, and 8.3% to 10.5% for Connecticut. New York City is known for its high poverty level. The gap between NYC, the U.S. average and the rest of the state is decreasing, but not for good reasons.
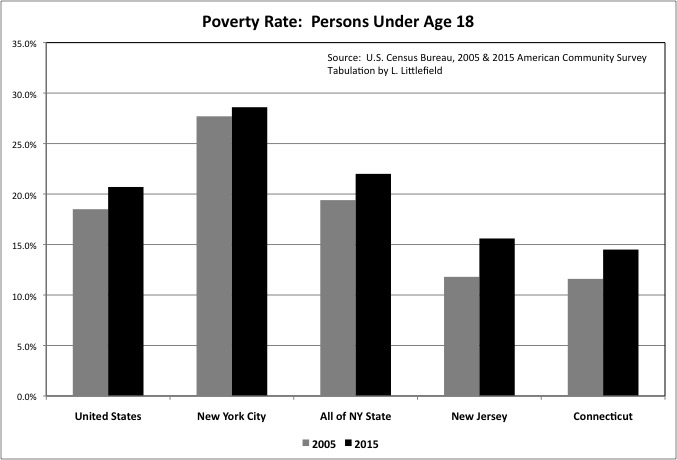
The poverty rate was already high in 2005 – and up over many decades – or American children. The U.S. poverty rate for those under age 18 increased from 18.5% that year to 20.7% in 2015. The increase in New York City was from 27.7% to 28.6%.
Family decline is one reason, and yet another way that younger generations are poorer, on average, than those who came before. Only 7.7% of U.S. married couple households with related children were poor in 2015, compared with 14.3% for New York City, 8.9% for New York State as a whole, 5.5% for New Jersey, and 3.7% for Connecticut. Poverty rates for children in single-parent families are much higher. But even among married couple families with children, the poverty rate was higher in 2015 than it had been in 2005. The increase was from 6.9% to 7.7% for the U.S., and 11.1% to 14.3% for New York City.
The poverty rate, moreover, is based on income and doesn’t include the entire decrease in spending power and the standard of living. Millions of families lost their homes to foreclosure from 2005 to 2015, often because they borrowed against their homes to finance consumer spending or the soaring cost of their children’s college.
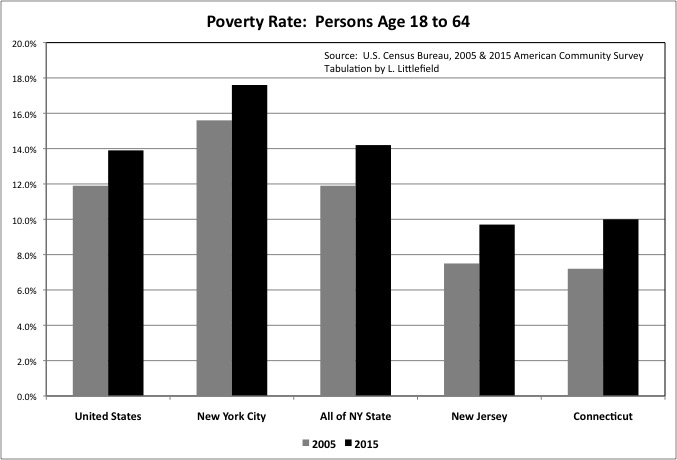
With a rising share of workers in low-paid service occupations. And a rising share of those over age 50 early retired into Supplementary Security Income (SSI). Poverty also increased among those ages 18 to 64 – from 11.9% to 13.9% for the U.S. as a whole, 15.6% to 17.6% for New York City, 11.9% to 14.2% for New York State as a whole, 7.5% to 9.7% for New Jersey and 7.2% to 10.0% for Connecticut. The falling U.S. minimum wage over the long term, adjusted for inflation, is a factor here. State and local government increases in the minimum wage by similarly be a factor in the increase in income from 2014 to 2015.
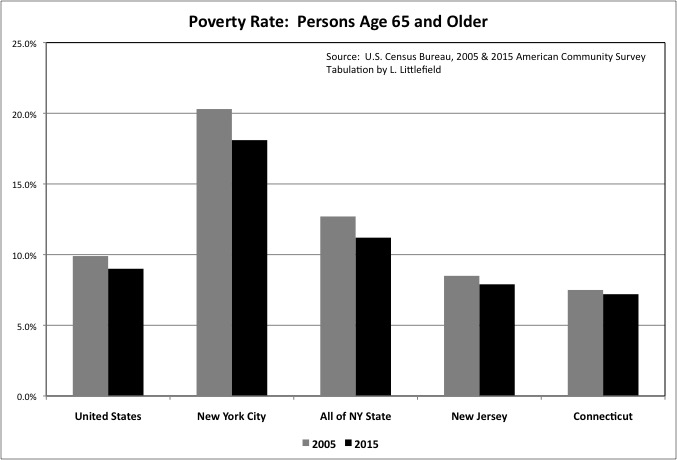
Looking over the business cycle, rather than just 2014 to 2015, the only age group with a falling poverty rate is the age group that had the lowest poverty rate already – those age 65 and over. The poverty rate for this group fell from 9.9% to 9.0% in the United States, 20.3% to 18.1% in NYC, 12.7% to 11.2% in New York State as a whole, 8.5% to 7.9% in New Jersey, and 7.5% to 7.2% in New Jersey.
Social Security is keeping today’s seniors, who at each phase of their lives have been the richest generations in U.S. history, out of poverty. But that doesn’t mean they are as well off as they want to be, expect to be, feel they are entitled to be. And thus their voting patterns. And those who follow will likely be even worse off, on average, when they become old themselves, as they have been throughout their lifecycle.
It is not that Americans are poor. May people who have seen their incomes fall could certainly afford the standard of living the “middle class” enjoyed in the 1950s and 1960s, and was very happy with at the time, and a moderate number of years in retirement relative to the number of years worked. With better health care and information technology and some other improvements. But they have been conditioned to feel impoverished if they do not have more than that, more like what they had during the years of phony, debt-fueled prosperty.
So there you have it. Those who have benefitted from the economic trends over 35 year, those who want to believe or at least pretend that things are fine, can point to low unemployment, low inflation, and a big increase in income and decrease in poverty from 2014 to 2015. But this ignores the fact that adjusted for the business cycle income is falling, poverty is increasing, and more and more Americans are facing the consequences of being paid less and not saving for retirement.
More fundamental measures of social well being than the American Community Survey are flashing red, notably the increase in the death rate and decrease in life expectancy for those born after 1957 or so.
Death is the Ultimate Statistic II: The Most Important News In Ten Years
And now there is another measure of social distress. How could Donald Trump, or all people, be so close to becoming President? Depression and desperation. Every vote for Trump is yet another indicator of just how bad things actually are.