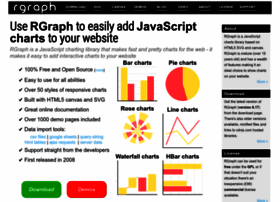
Rgraph - rgraph.net - RGraph news and HTML5 canvas examples

General Information:
Latest News:
New RGraph.each() function 26 Aug 2013 | 06:00 pm
The next beta release will have an "each()" function - much like the jQuery $.each() function - which is useful for iterating over arrays.The callback function gets called for each element of the arra...
A clickable filled Line chart 22 Aug 2013 | 07:00 pm
As a result of a recent support request here's an example of making filled line charts where the fill itself is clickable. It's done in conjunction with the drawing API Poly object - which is placed o...
An example of using DIV tags for hit testing with HTML5 canvas 16 Aug 2013 | 11:00 pm
As mentioned in the article that details the forth-coming hit regions addition to HTML5 canvas one option that you have for hit testing is placing DIV tags over the canvas and adding the event listene...
RGraph licensing invoices 15 Aug 2013 | 06:00 am
If you've been hankering after an RGraph invoice you may have noticed that the "Get invoice" page wasn't sending the invoice out. This has now been resolved and in addition there's a new invoice page ...
An example of HTML5 canvas video zoom 21 Jul 2013 | 12:00 am
This is an example of using HTML5 video in conjunction with two canvas tags to show a video on one - which you can select an area of to zoom in on - which is shown on the right canvas.
A mirror effect with the HTML5 canvas setTransform() function 21 Jul 2013 | 12:00 am
This is an example of using the setTransform() function to invert your canvas and achieve a mirror effect. In this example the mirror effect is only in the X direction - though it could be easily modi...
An example of HTML5 canvas video 15 Jul 2013 | 07:00 pm
By using the HTML5 canvas drawImage() function, that is normally used to draw images on to your canvas tag, you can draw video on to your canvas. By repeating the drawImage() call roughly 60 times a s...
CanvasPath: A path object for canvas 1 Jul 2013 | 06:00 pm
CanvasPath is a new Open Source project that provides a path object to HTML5 canvas. It uses SVG style syntax for paths (its not quite the same though) and means that building paths for canvas is much...
New example of HTML5 CSS3 transformations 12 Jun 2013 | 10:00 pm
The older example of CSS3 3D transformations has been updated and turned into a blog article. The browser support has improved since it was created a few years ago so now you can use Chrome, Safari, F...
Dotted and dashed background grid options 26 May 2013 | 02:00 am
A quick and simple demo of the new background grid options that will be available using the new, Chrome only, setLineDash() canvas API function. In RGraph you can add it with the chart.background.grid...

